
Extended Data Fig. 6. DNA methylation patterns as determined from the ONT data across the three contiguously assembled Y chromosomes.
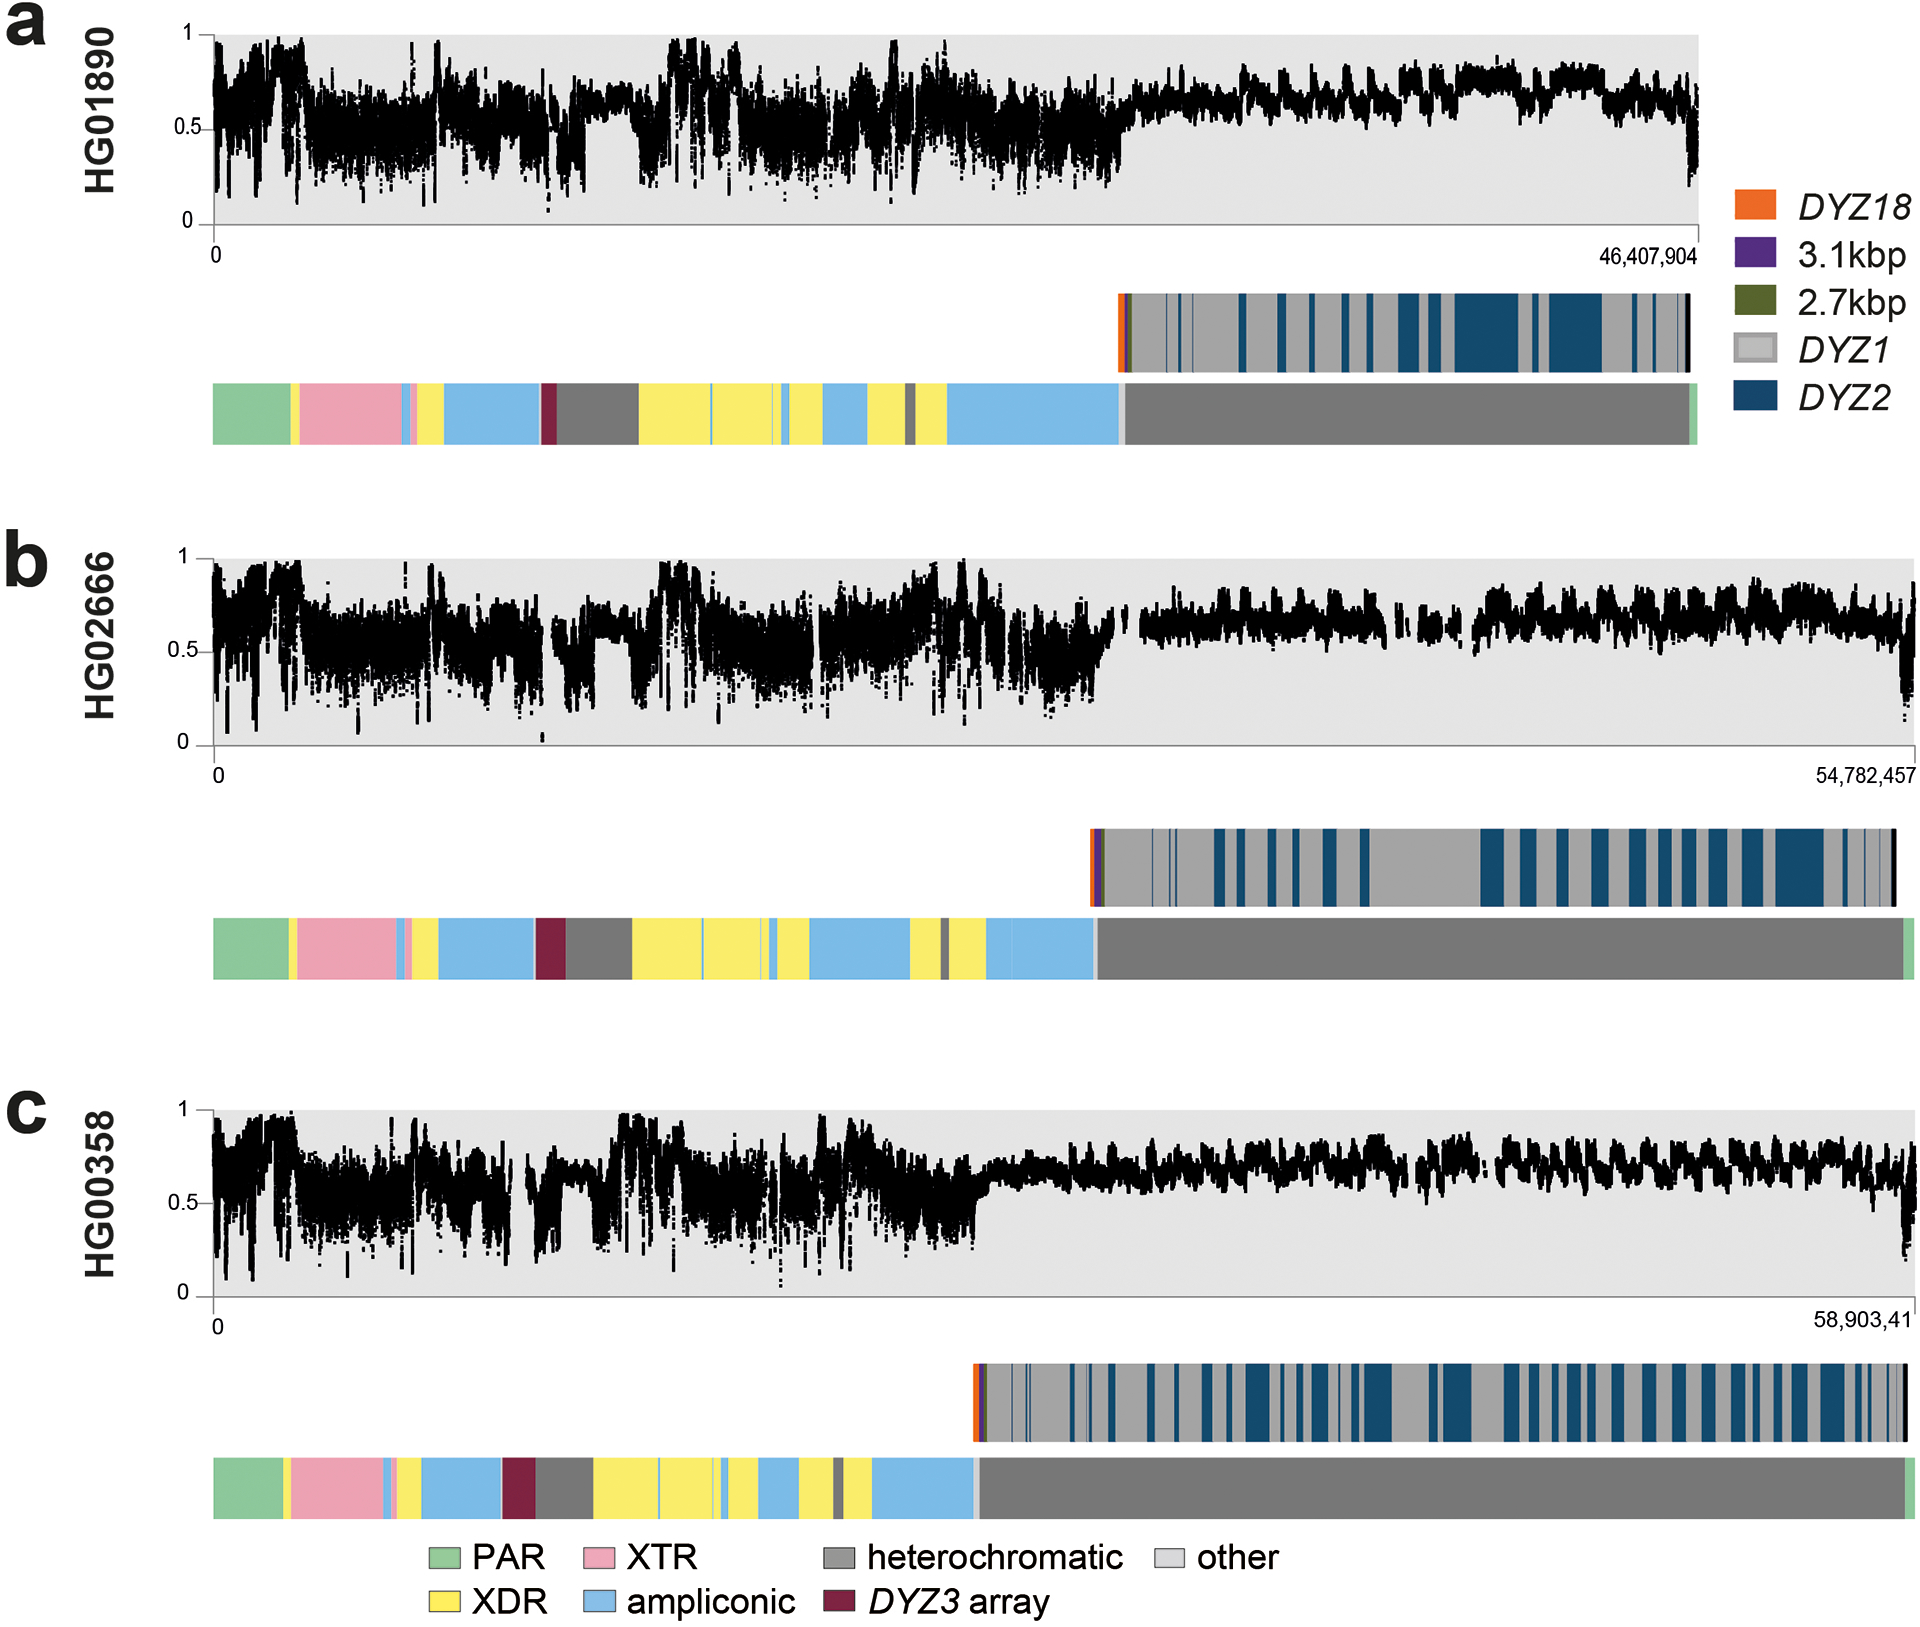
Methylation patterns for samples: a. HG1890, b. HG02666 and c. HG00358. The three dot plots (in grey) show the smoothed DNAme levels, in 5 kbp windows for visualization, in beta-scale ranging from 0 (not methylated) to 1 (methylated). The locations of Yq12 repeat arrays (DYZ18, 2.7kb-repeat, 3.1kb-repeat, DYZ1 and DYZ2) and the Y-chromosomal subregions are shown below as bar plots.