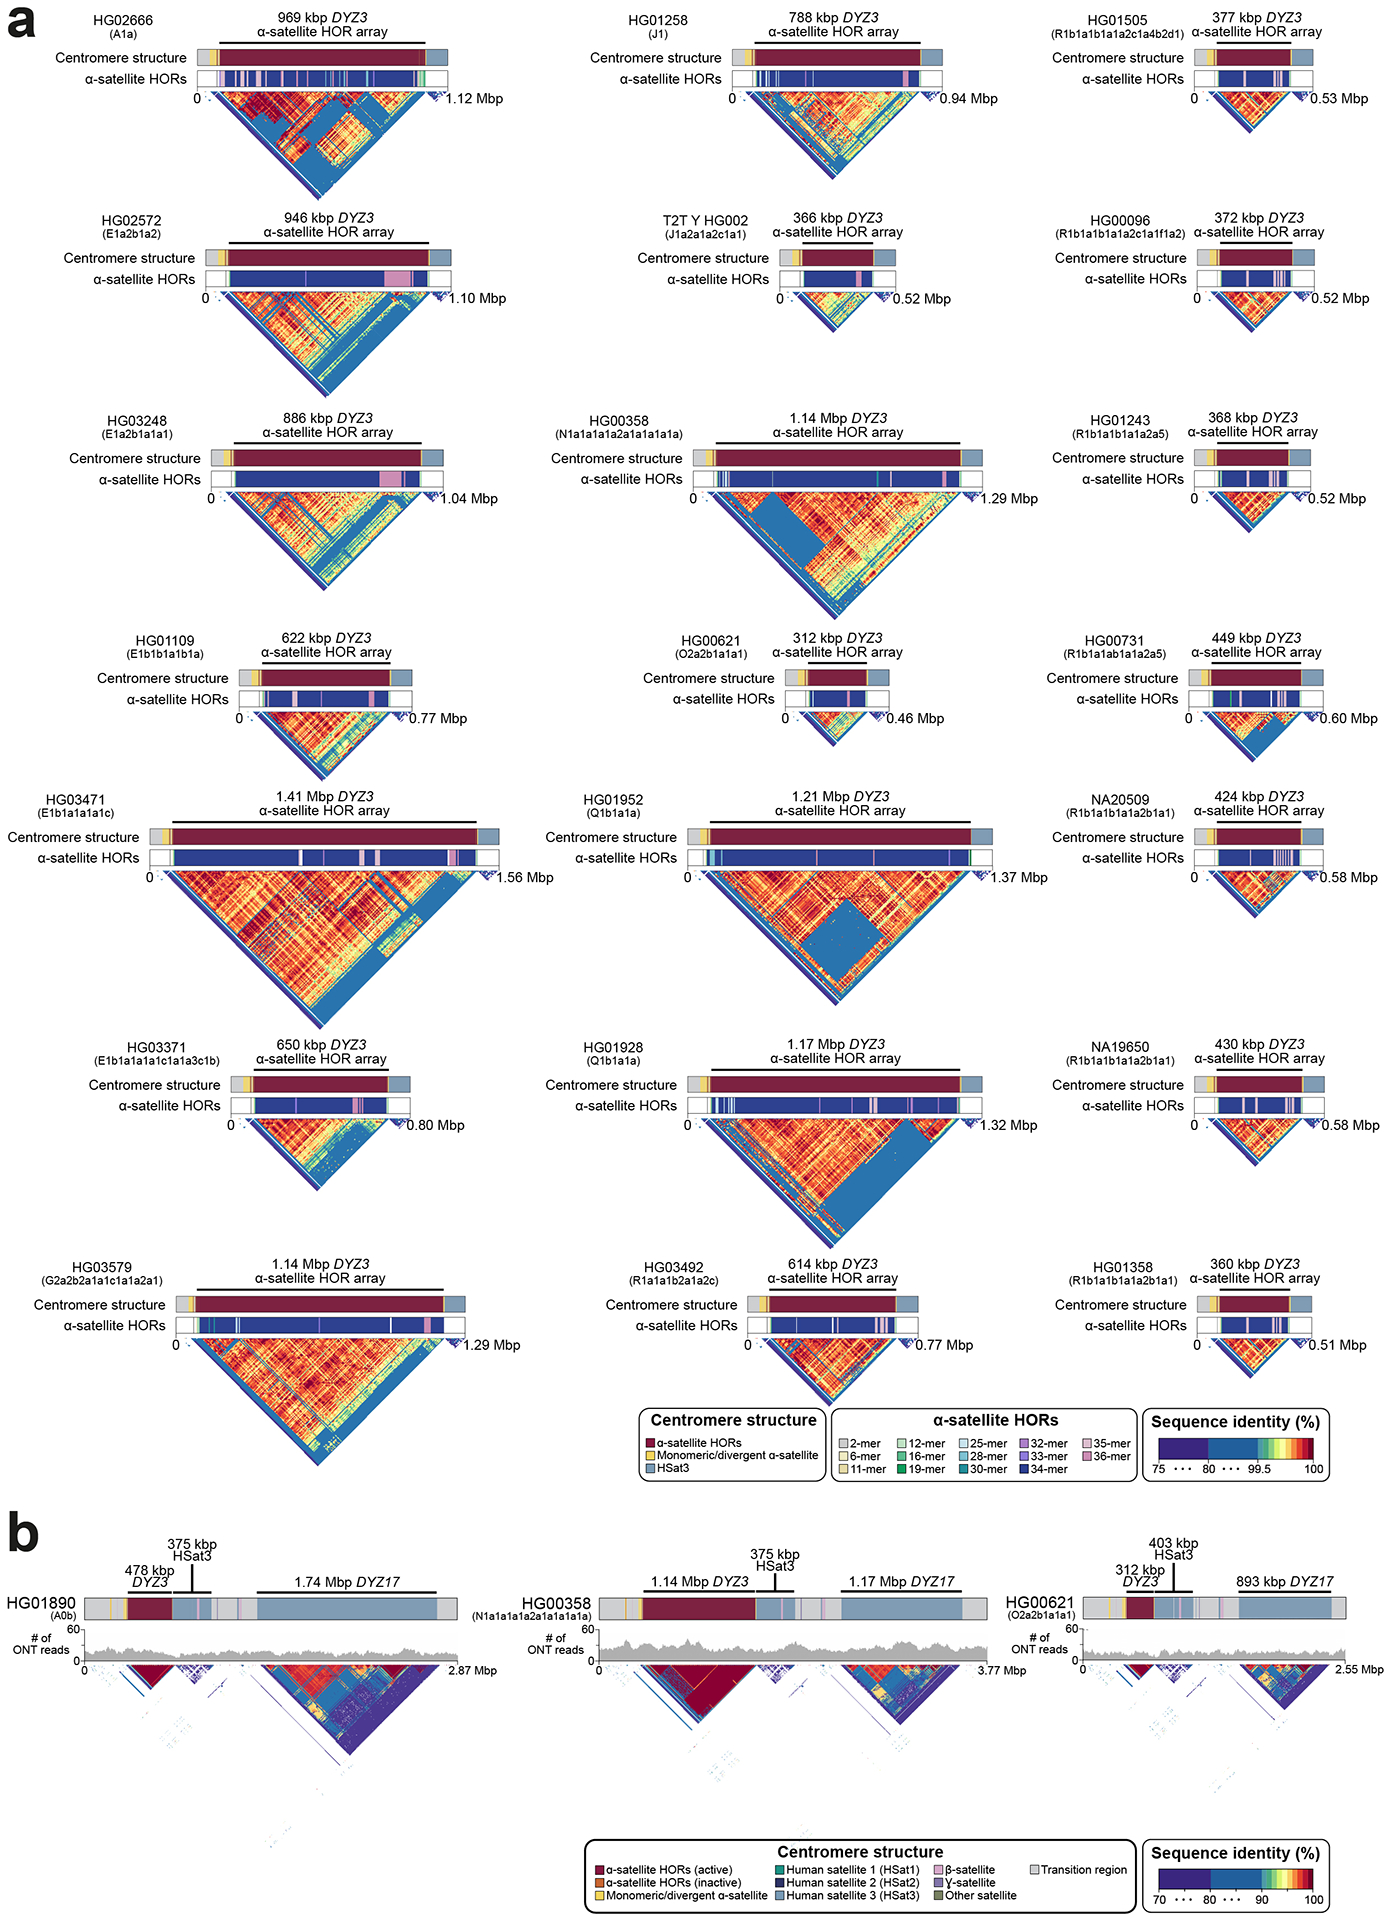
Extended Data Fig. 8. Composition of the Y-chromosomal (peri-)centromeric regions.

a. Organization of the chromosome Y centromeric region from 21 genomes representing all major superpopulations. The structure (top), α-satellite HOR organization (middle), and sequence identity heat map (bottom) for each centromere is shown and reveals the presence of novel HORs in over half of the centromeres. Note - the sizes of the DYZ3 α-satellite array are shown on top as determined using RepeatMasker42 (Methods).
b. Genetic landscape of the Y-chromosomal pericentromeric region for three select samples (see Figs. S47–S48 for all samples). The top panel shows locations and composition of the pericentromeric region with repeat array sizes shown for each Y chromosome (the DYZ3 α-satellite array size as determined using RepeatMasker, Methods). The middle panel shows (UL-)ONT read depth and bottom sequence identity head maps generated using StainedGlass pipeline43 (using a 5 kbp window size).
