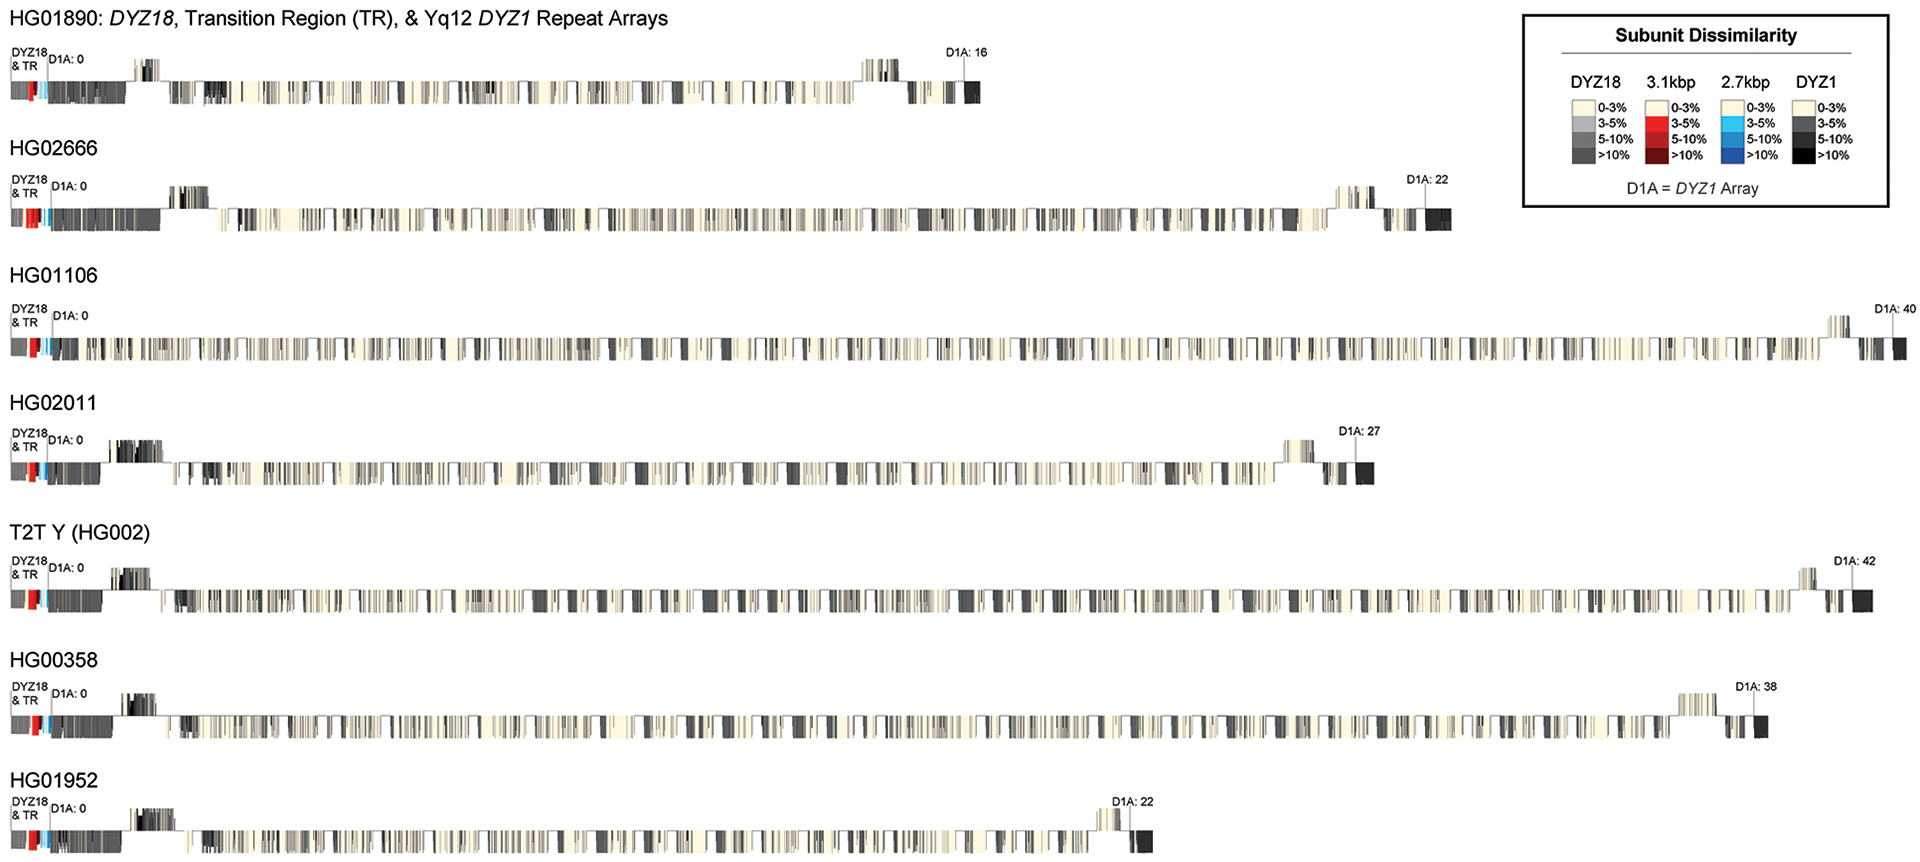
Extended Data Fig. 9. Divergence of DYZ18, Yq11 /Yq12 transition region and DYZ1 repeat units.

An overview of the Bray-Curtis distance/dissimilarity of k-mer abundance profiles for individual DYZ18 (grey), 3.1-kbp (red), 2.7-kbp (blue) and DYZ1 (black) repeats versus their consensus sequence. The Yq11/transition region/Yq12 are shown for each of the seven samples with a completely assembled Yq12 subregion. Lighter colours indicate less distance/dissimilarity (i.e., more similar) k-mer abundance profiles compared to their consensus sequence. Results indicate that arrays located on the proximal and distal boundaries of the Yq12 subregion contain repeats with k-mer abundance compositions less similar to their consensus sequence (i.e., more diverged). The size of individual lines is a function of the length of the repeat. The repeat unit orientation (above = sense, below = antisense) was determined based on RepeatMasker annotations of satellite sequences within repeats (Methods).
