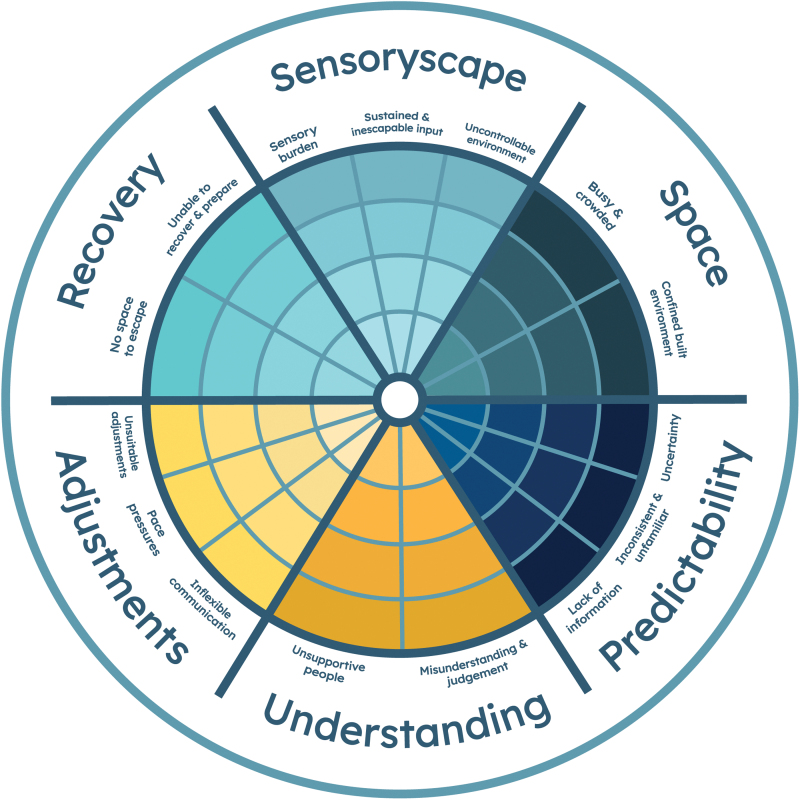
FIG. 1.
Graphical representation of the principles of sensory environments, including the main themes and subthemes developed from the reflexive thematic analysis. For each subtheme, the outer segments of the web (darker shaded colors) represent more disabling environments (e.g., a higher sensory burden with an array of aversive sensory input), whereas segments closer to the center (lighter shaded colors) represent more enabling environments (e.g., a lower sensory burden with reduced or less aversive sensory input). This figure was reproduced from https://osf.io/vtqr8 under a CC-BY license.

