
FIGURE 6.
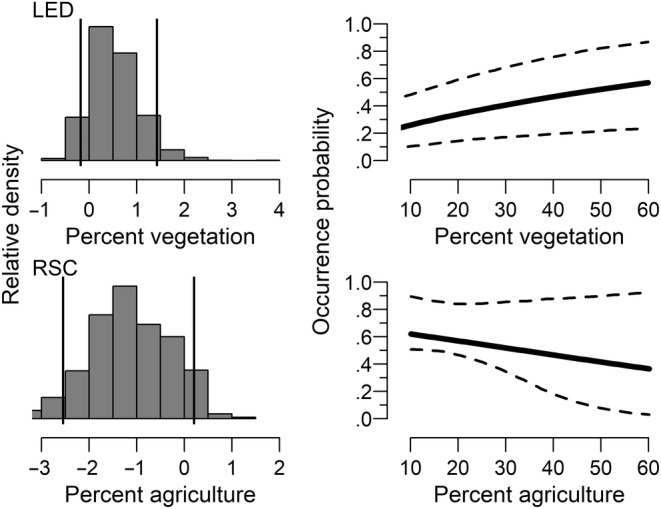
Relationship between occurrence probability and percent vegetation for least darter (LED, upper panels) and relationship between occurrence probability and percent agriculture for redspot chub (RSC, lower panels). The histograms in the left panels are a visual representation of the posterior distribution for the covariate slopes. The vertical lines approximate endpoints of 95% highest density intervals. Dashed lines in the right panels are 95% credible intervals.