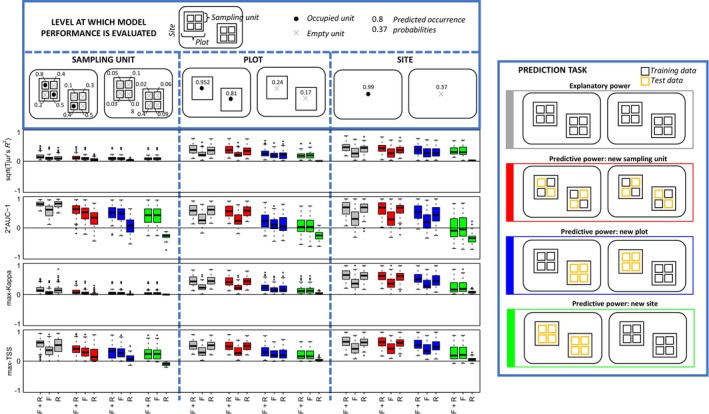
FIGURE 3.

Evaluation of model performance based on the empirical case study. Each boxplot shows the distribution of model evaluation measures over the 68 species included in the study. The rows of panels correspond to Tjur's R 2 (square root transformed), AUC (2x−1 transformed), max‐Kappa, and max‐TSS. Model performance has been evaluated at the three hierarchical levels of sampling unit, plot, and site. The legend box on the top exemplifies how the predicted occurrence probabilities at the level of the sampling unit accumulate as occurrence probabilities at the plot and site level, respectively. The legend box on the right shows how the models have been used for four different prediction tasks that translate to different partitionings of the data into training and test sets. The results are shown for the three different model variants that contain both fixed and random effects (F & R), fixed effects only (F), or random effects only (R).
