
Fig. 1.
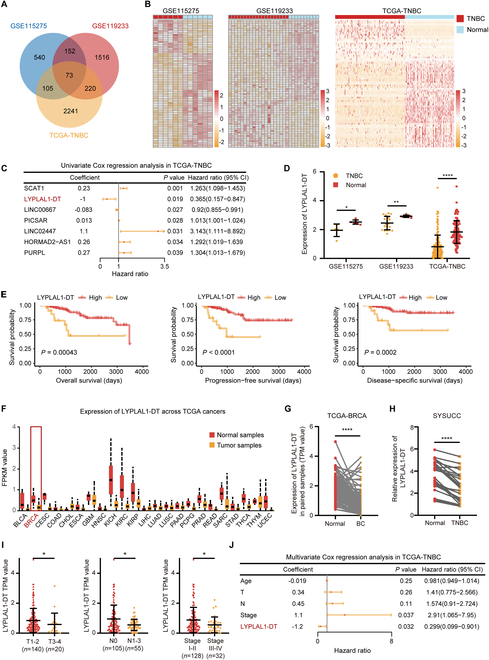
LYPLAL1-DT expression is curbed in TNBC samples and correlates with a favorable prognosis. (A) Venn diagram depicting the identification of 73 common differentially expressed lncRNAs from GSE115275, GSE119233, and TCGA-TNBC cohorts. (B) Heatmaps showing the expression patterns of 73 candidate lncRNAs in three datasets. (C) Univariate Cox regression analysis based on 73 eligible lncRNAs in TCGA-TNBC dataset. (D) Expression level of LYPLAL1-DT in TNBC and nontumor normal samples of three datasets. (E) Kaplan–Meier curves displaying TNBC patients with high expression of LYPLAL1-DT gain favorable overall survival, progression-free survival, and disease-specific survival. (F) Expression level of LYPLAL1-DT in tumor and nontumor normal samples across various cancer types in the TCGA cohort, including breast cancer (BRCA). (G) Expression level of LYPLAL1-DT in 120 matched breast cancer (BC) and noncancerous normal samples of the TCGA-BRCA cohort. (H) Relative expression level of LYPLAL1-DT in 24 pairs of TNBC and matched nontumor tissues of the SYSUCC cohort using RT-qPCR. (I) Expression level of LYPLAL1-DT in TNBC patients with various T stage, N stage, or AJCC stage from the TCGA-TNBC cohort. (J) Multivariate Cox regression analysis incorporating age, T stage, N stage, AJCC stage, and LYPLAL1-DT. Error bars represent mean ± SD. *P < 0.05, **P < 0.01, ****P < 0.0001.