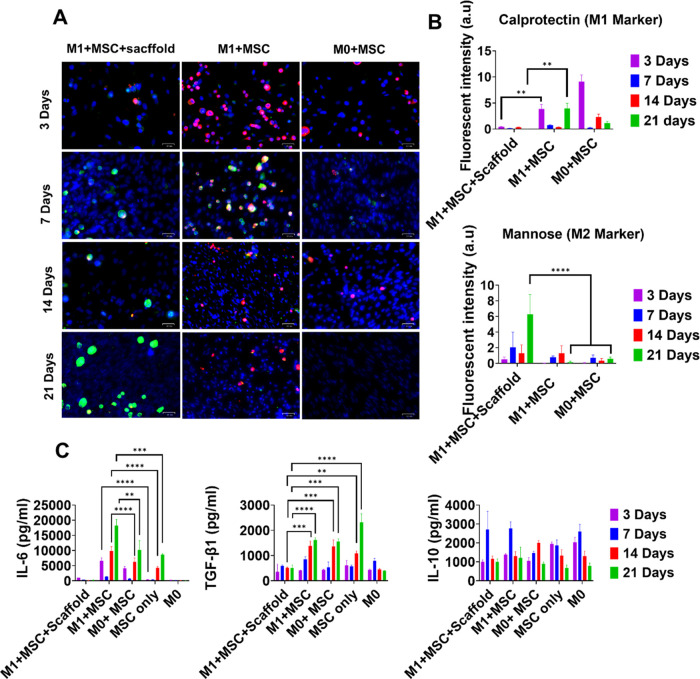
Figure 9.
Macrophage activation status in co-cultures. (A) Immunostaining of M1 marker calprotectin (red) and M2 marker mannose receptor (green) and cell nuclei (blue). Scale bar, 100 μm. (B) Quantified fluorescence intensity of calprotectin and mannose receptors. (C) Quantifying pro-inflammatory (IL-6) and anti-inflammatory cytokines (TGF-β1 and IL-10). All data represent mean ± SD (n ≥ 3). * p < 0.05, ** p < 0.01, *** p < 0.001, **** p < 0.0001.

