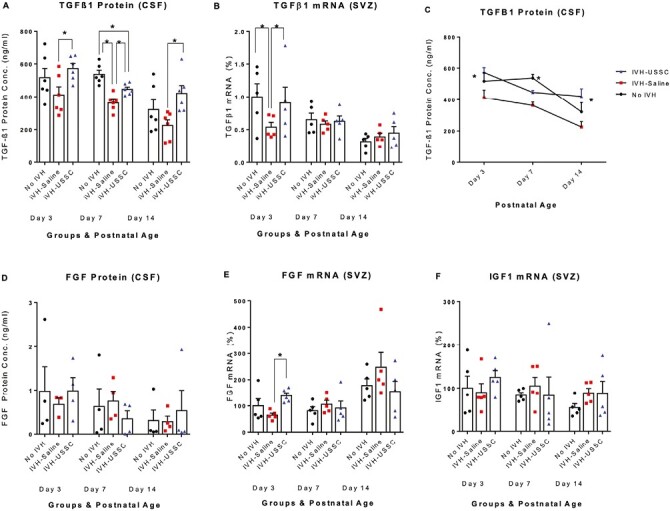
Figure 6.

USSC administration altered the early postnatal expression of growth factors TGF-β1 and FGF after IVH. (A-C) Scatter plot with bar graph and Lane chart showing the expression of TGF-β1 protein and gene expression in CSF and SVZ dissected tissue mRNA. (A) Scatter plot with bar graph showing decreased TGF-β1 protein levels in the CSF of IVH pups compared to control pups, whereas USSC-treated pups showed significantly increased expression at postnatal days 3, 7, and 14. (*P < .05, Ctrl vs. IVH at day 7, and IVH vs. USSC pups at day 3, 7, and 14, n = 5-6 pups in each group). The data represents mean ± SEM (ng/mL). Assay using ELISA kit (Ray Biotech., catalog # ELH-TGFβ1). (B) Scatter plot with bar graph showing decreased TGF-β1 mRNA expression in IVH pups compared to control pups, whereas USSC-treated pups showed significantly increased expression at postnatal day 3. (*P < .05, Ctrl vs. IVH as well as IVH vs USSC pups at day 3, whereas other postnatal ages were comparable in mRNA expression, n = 5 pups in each group). (C) Line graph showing falling TGF-β1 protein levels in the CSF over the first 2 postnatal weeks independently of treatment assignments. Two-way ANOVA showed significant differences for IVH vs. USSC treatment for day 3 and day 14 (P < .05 for both) and also for control vs IVH group at day 7 (P < .05). (D-E) Scatter plot with bar graph showing the expression of FGF protein and gene expression in CSF and dissected tissue RNA. (D) Scatter plot with bar graph showing decreased FGF protein levels in the CSF in IVH pups compared to control pups, whereas USSC-treated pups showed a trend to increase values at postnatal day 3. All comparisons were not significant, n = 4 pups in each group). The data represents mean ± SEM (ng/mL). (E) Scatter plot with bar graph shows decreased FGF mRNA levels in IVH pups compared to control pups, whereas USSC-treated pups showed significantly increased values at postnatal day 3. (*P < .05, IVH vs USSC pups at day3, whereas other postnatal ages were comparable in mRNA expression, n = 5 pups in each group). (F) Scatter plot with bar graph showing the expression of IGF1 mRNA levels in dissected tissue that is comparable at all postnatal ages. The data represents mean ± SEM; for each group for 3 postnatal days 3, 7, and 14, n = 5 pups in each group.
