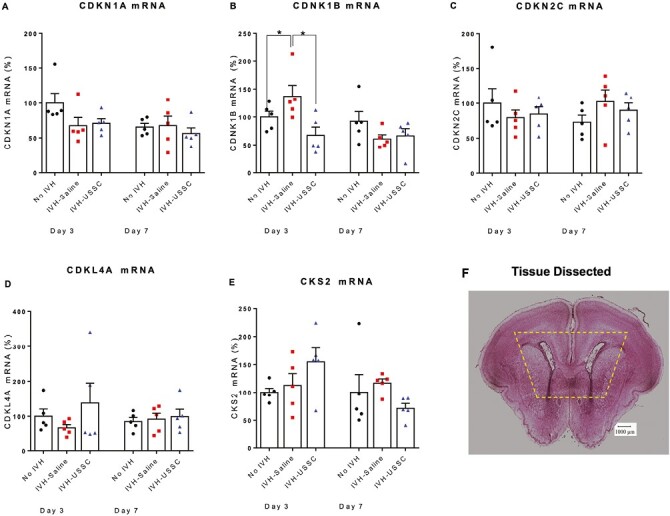
Figure 7.

Scatter plot with bar graph showing the cell cycle regulated gene mRNA levels after USSC administration in IVH. (A) Scatter plot with bar graph shows comparable CDKN1A (p21) mRNA levels in healthy controls, IVH saline and USSC-treated IVH pups at postnatal days 3 and 7. All groups were comparable in mRNA values, n = 5 pups in each group. (B) Scatter plot with bar graph shows increased CDKN1B (p27) mRNA expression in IVH pups compared to control pups, whereas USSC-treated pups showed significantly decreased expression at postnatal day 3. (*P < .05, Ctrl vs. IVH as well as IVH vs. USSC pups at day 3; other postnatal ages days 3 and 7 were comparable in mRNA values, n = 5 pups in each group). (C) Scatter plot with bar graph shows comparable CDKN2C mRNA levels in healthy controls, IVH and USSC-treated pups at postnatal days 3 and 7. All groups were comparable in mRNA values, n = 5 pups in each group. (D) Scatter plot with bar graph shows comparable KLF4 mRNA levels in healthy controls, IVH, and USSC-treated pups at postnatal days 3 and 7. All groups were comparable in mRNA values, n = 5 pups in each group. The USSC administration in IVH pups showed a trend to increase compared with IVH saline group. (E) Scatter plot with bar graph shows comparable CKS4 mRNA levels in healthy controls, IVH, and USSC-treated pups at postnatal days 3 and 7. All groups were comparable in mRNA values, n = 5 pups in each group. (F) Representative hematoxylin and eosin (H&E) stained coronal section taken at the level of mid-septal nucleus showing landmarks of dissected areas of coronal tissue used for RNA isolation and TaqMan gene expression assay; 20 µm sections.
