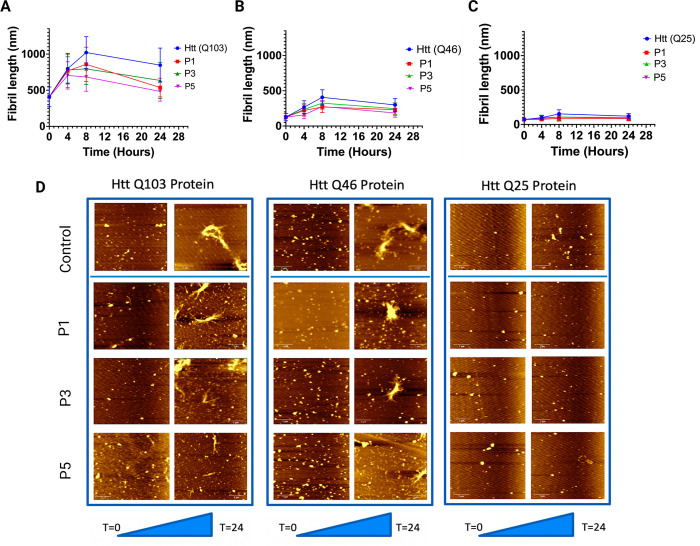
Figure 3.
Kinetics of aggregation of the Htt(Q103), Htt(Q46), and Htt(Q25) protein. (A) Shows change in fibril length both control Htt(Q103) and peptide treated Htt(Q103) with respect to time. (B) Shows change in fibril length both control Htt(Q46) and peptide treated Htt(Q46) with respect to time. (C) Shows change in fibril length both control Htt(Q25) and peptide treated Htt(Q25) with respect to time. The fibril length was measured after 0, 4, 8, and 24 h, and the mean length of 100 fibrils and standard deviation at each time point is plotted. (D) Shows AFM images of all three proteins, both in the presence and absence of peptides, taken at t = 0 and t = 24 of the aggregation. All images show large-scale views with scale bars are 1 μm.

