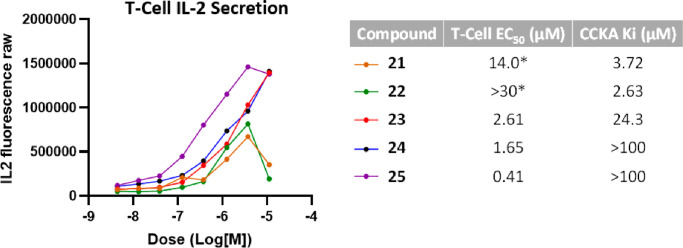
Figure 5.
Dose–response curves of selected compounds in a T-cell IL-2 secretion assay. Corresponding T-cell EC50 values are shown on the right as an average of at least three determinations, along with the binding affinity values for off-target CCKA as an average of at least two determinations. *EC50 values calculated are based on fitting to a sigmoidal curve.

