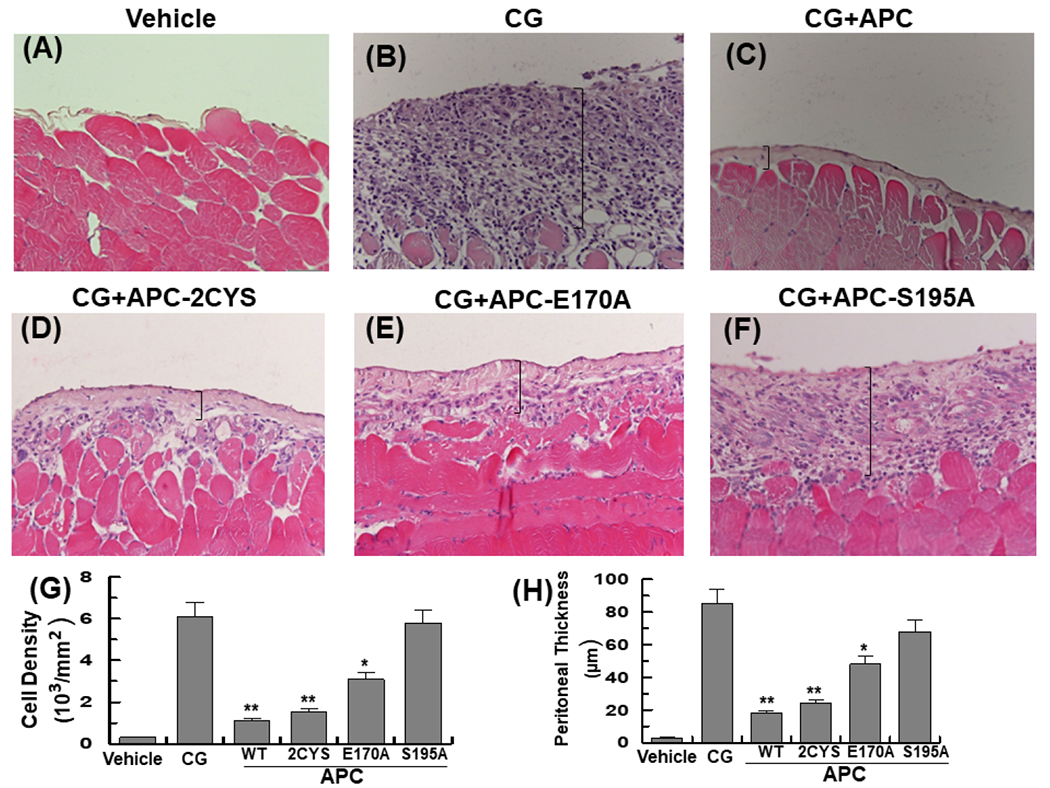
Figure 1. APC suppresses peritoneal cell density and thickening of peritoneal membrane in CG-injected mice.

(A-F) Representative light microscopic features of H&E staining of peritoneal tissues on day 21 in control (vehicle, normal saline) mice (A), CG-injected mice treated with the vehicle alone (B), CG-injected mice treated with APC-WT (50 μg/kg/day for all groups) (C), APC-2Cys (D), APC-E170A (E), and APC-S195A (F). Brackets show the thickness of the submesothelial compact zone. (G-H) Quantification of cell density and thickness of the submesothelial compact zone in all groups. The data are shown as mean ± SEM (n= 10), *p< 0.05 and **p<0.01 (APC: 50 ug/kg/day in entire study). Scale bar =5μm. In all figure legends (n) indicates number of animals analyzed.
