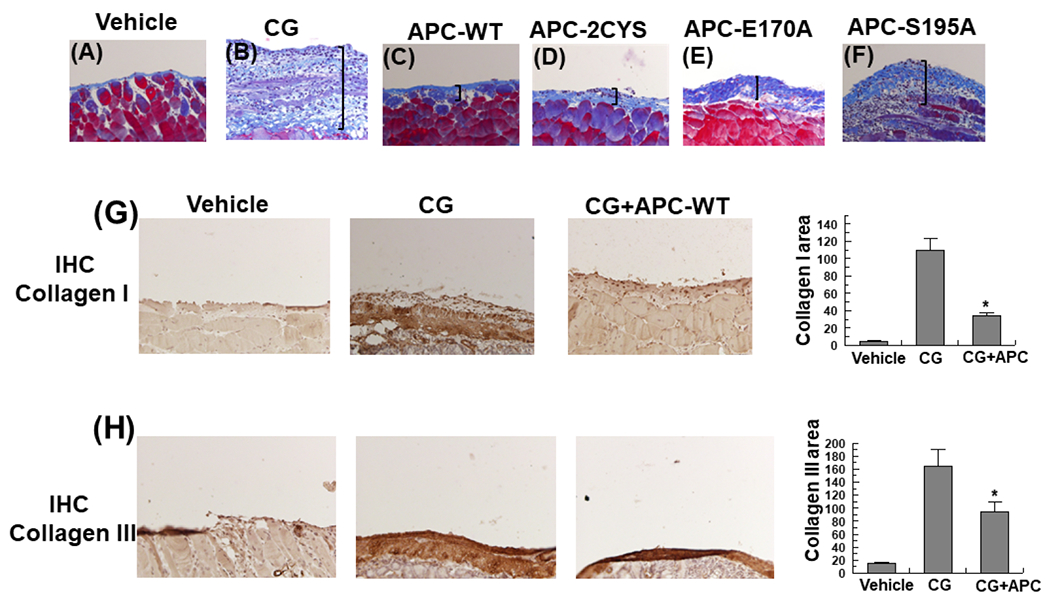
Figure 2. APC suppresses collagen expression in peritoneal tissues of CG-injected mice.

(A-F) Representative light microscopic features of Masson’s trichrome staining of peritoneal tissues on day 21 in control (vehicle) mice (A), CG-injected mice treated with the vehicle (B), CG-injected mice treated with APC-WT (C), APC-2Cys (D), APC-E170A (E) and APC-S195A (F). n= 10 in all group. (G-H) Immunohistochemical analysis of collagen I (G) and collagen III (H) expression in peritoneal tissues on day 21 in vehicle group mice, CG-injected mice treated with the vehicle alone, and CG-injected mice treated with APC-WT. The stained areas for collagens I and III are presented next to each panel on the right. The data are shown as mean ± SEM, n= 5, *p< 0.05 and **p<0.01. Scale bar =50μm.
