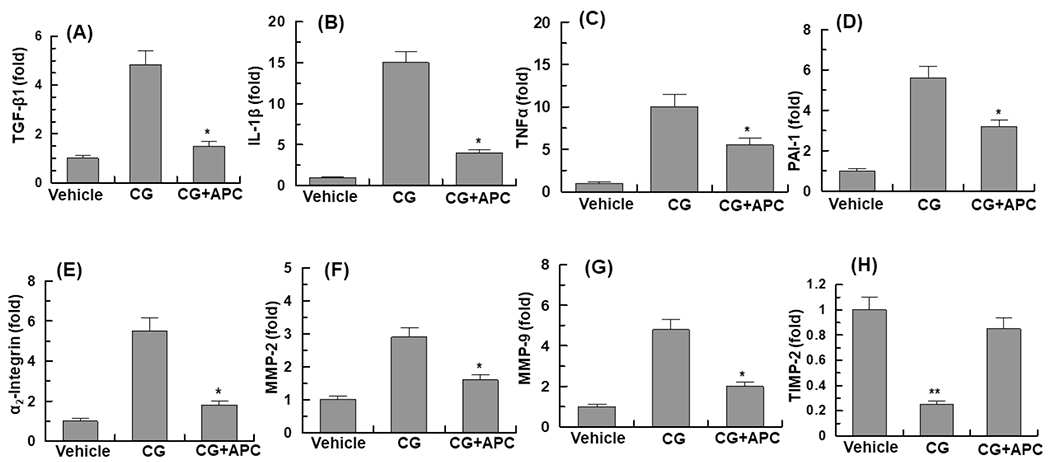
Figure 5. Analysis of mRNA expression levels of peritoneal tissues.

Real-time quantitative PCR was used to analyze the mRNA expression levels in peritoneal tissues of vehicle group, CG-injected treated with vehicle and CG-injected mice treated with APC-WT: (A), TGF-β 1; (B), IL1-β; (C), TNFα; (D), PAI-1; (E), α2-integrin; (F), MMP-2; (G), MMP-9; (H), TIMP-2. The data are shown as mean ± SEM, n=5, *p<0.05 and **p<0.01 as compared to CG-injected vehicle treatment.
