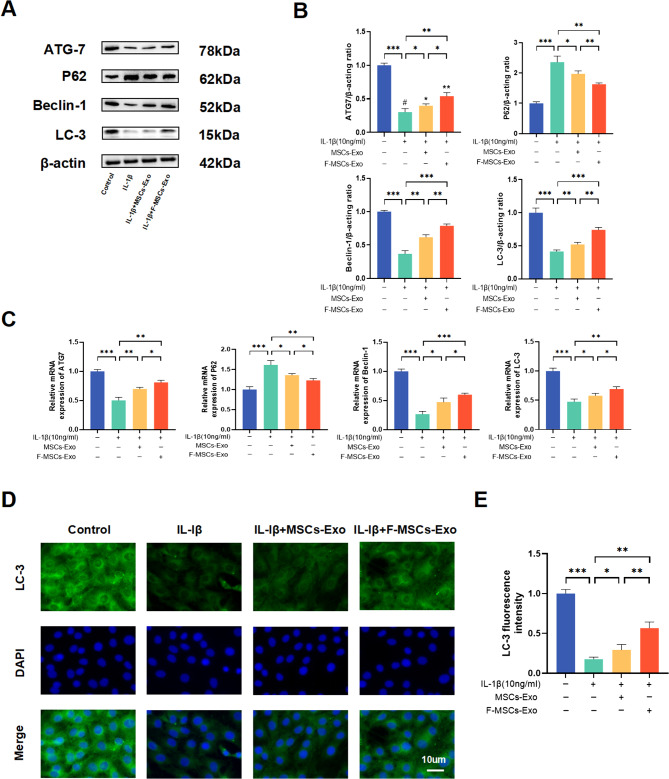
Fig. 4.
Effects of MSCs-Exo and F-MSCs-Exo on autophagy of chondrocytes in vitro. (A, B) Western blot analysis was performed to detect the impact of MSCs-Exo and F-MSCs-Exo on autophagy-related indicators of chondrocytes. (C) Real-time PCR technology was used to evaluate the effects of MSCs-Exo and F-MSCs-Exo on autophagy-related indicators of chondrocytes at the gene expression level. (D, E) The expression of LC-3, a marker for autophagy, was quantitatively analyzed using immunofluorescence staining and ImageJ software to provide a detailed assessment of the autophagy levels in response to MSCs-Exo and F-MSCs-Exo treatment (scale bar = 10 μm). (ns, no significant difference; *p < 0.05; **p < 0.01; ***p < 0.001; n = 3)

