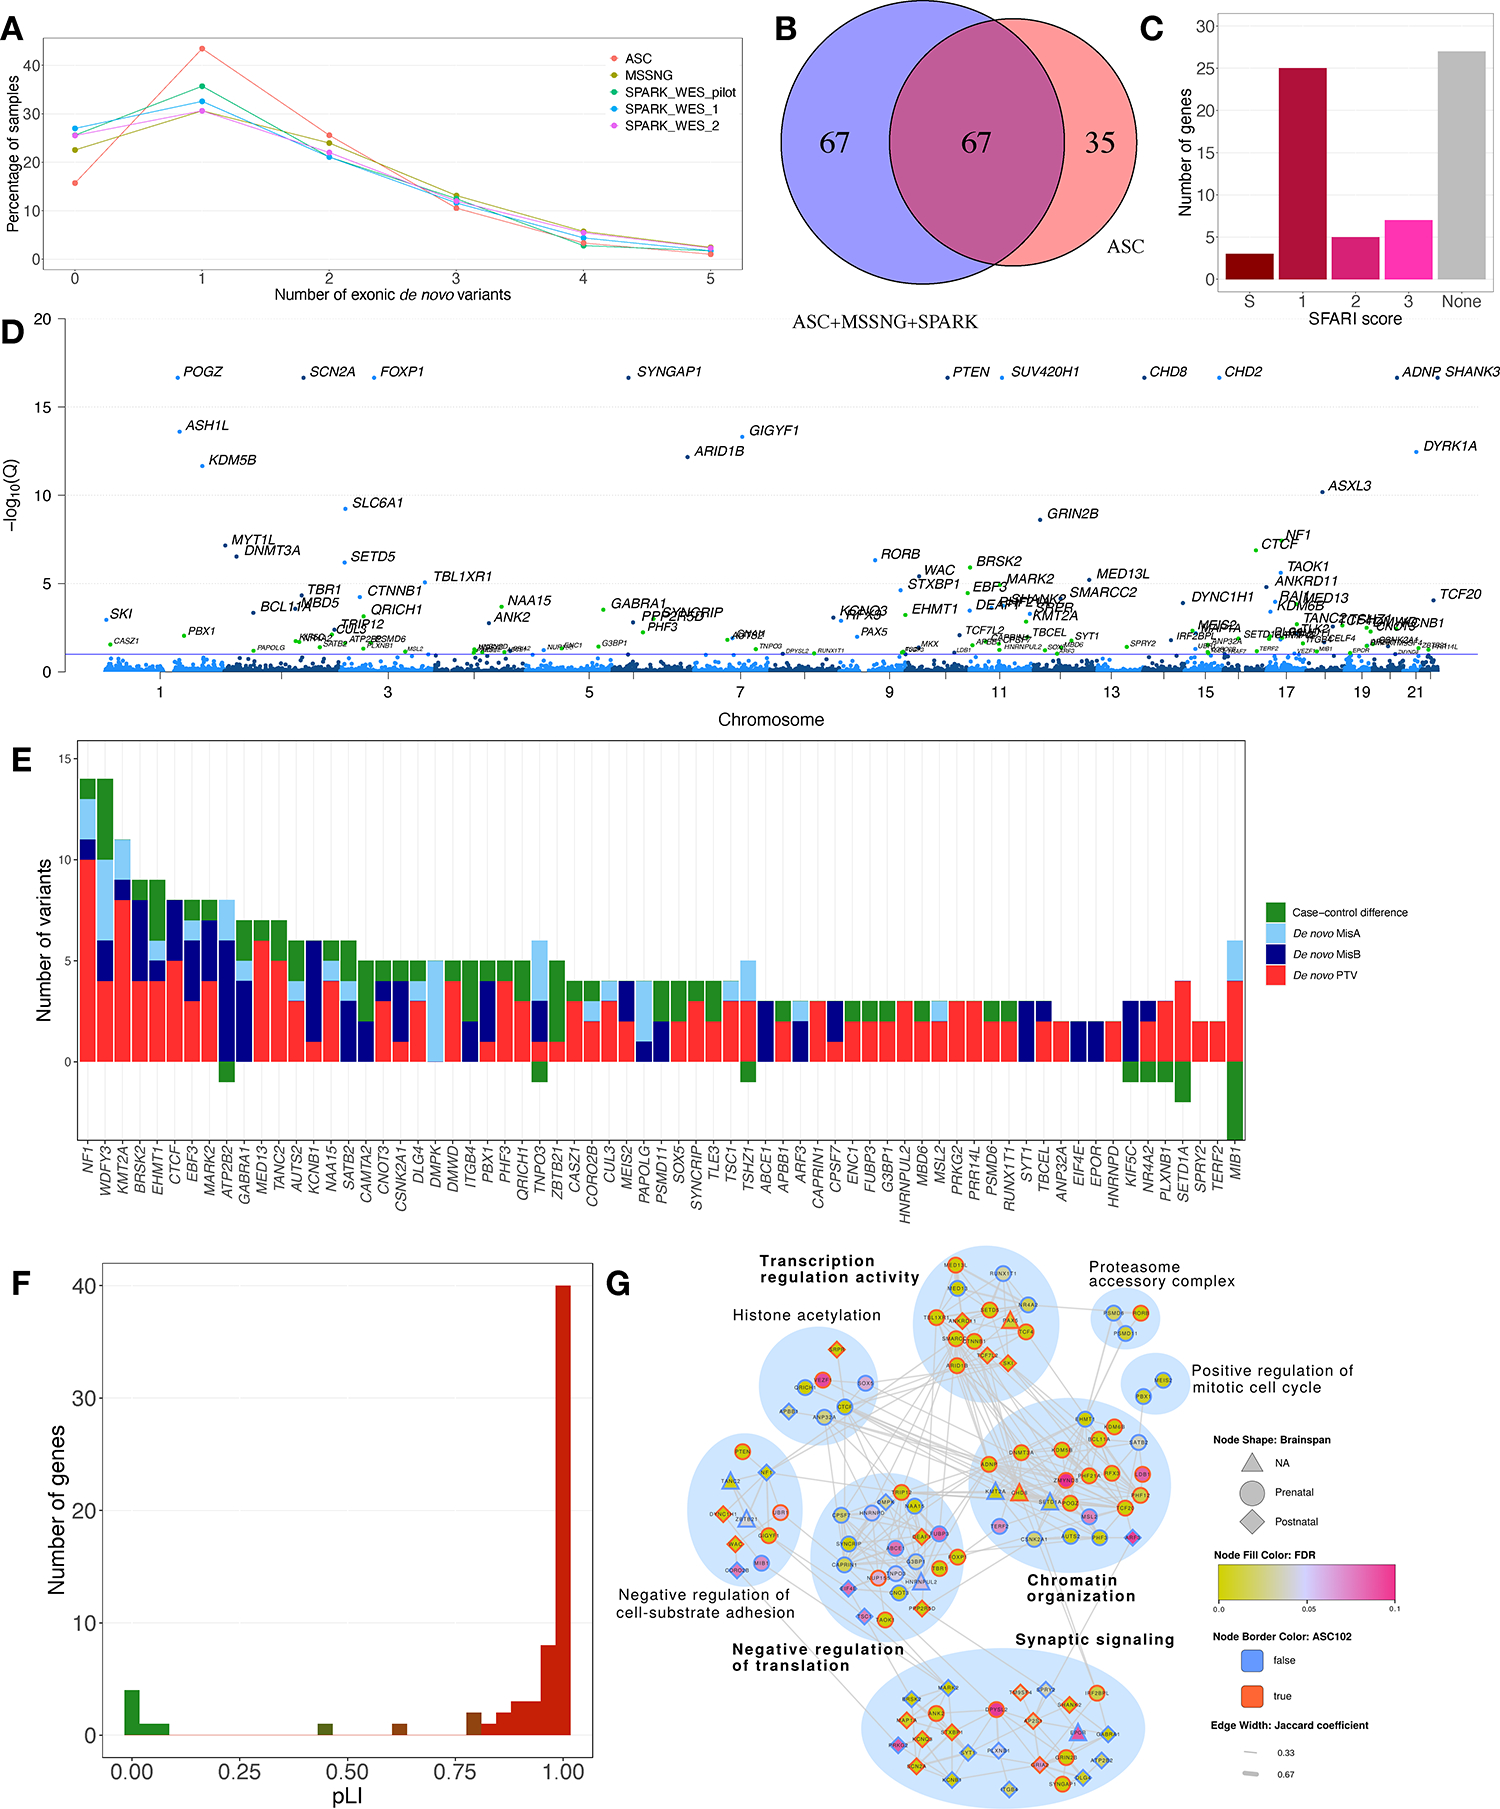
Figure 2. Identification of ASD-Associated Genes Using TADA+.

(A) Exonic de novo variants per individual in ASC, MSSNG, and SPARK. (B) ASD-associated genes discovered only in the previous TADA+ analysis8 (“ASC”), only in the current analysis (“ASC+MSSNG+SPARK”), or both. (C) Distribution of SFARI Gene scores for the newly discovered genes. (D) FDRs for the 134 ASD-associated genes. Blue dots: genes also identified in the previous TADA+ analysis; green dots: new genes. Genes with FDR calculated as zero were assigned a value of 10−17. The blue line represents FDR=0.1. (E) Evidence supporting the new ASD-associated genes. “Case-control difference” represents PTVs in cases minus controls. The y-axis is truncated at −3; the value for MIB1 is −9. (F) pLI values for the new genes. (G) Network diagram of TADA+ genes. Only genes connected to gene networks are shown. Nodes represent genes, and edges represent protein-protein and pathway interactions between gene pairs. Modules are indicated by blue circles, with module labels derived from GO term enrichment tests (bold: significantly enriched).
