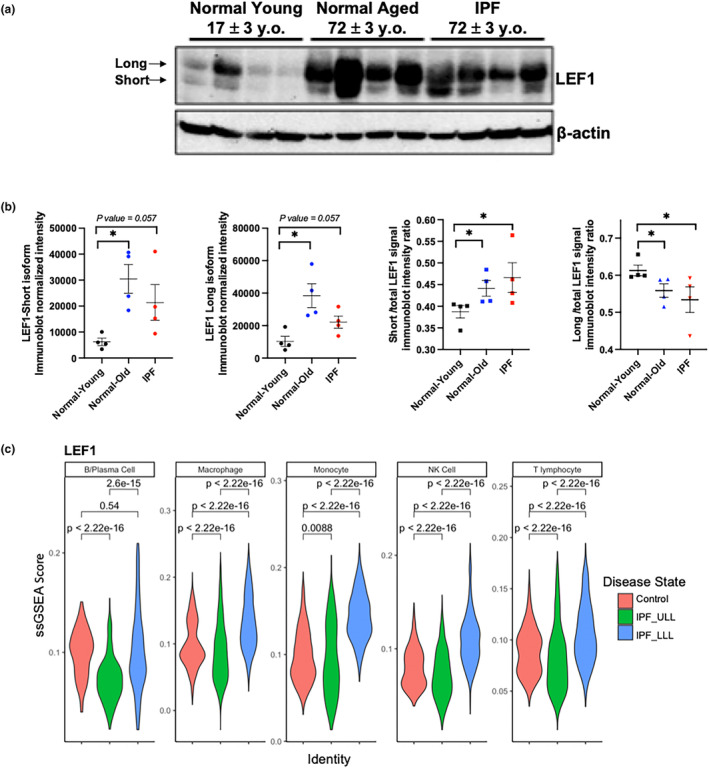
FIGURE 4.

LEF1 expression in human lung tissue lysates. (a) LEF1 immunoblot of four normal healthy young, four healthy old, and four IPF human lung tissue lysates. (b) Quantification of LEF1 isoforms using β‐actin used as a loading control. Data represent the mean value ± SEM (n = 4 samples evaluated per group). *p < 0.03, pairwise non‐parametric Mann–Whitney test. (c) Violin plot graphs showing LEF1 ssGSEA scores in human lung immune cells. IPF, idiopathic pulmonary fibrosis; IPF‐LLL, lower lung lobe; IPF‐ULL, upper lung lobe.
