
FIGURE 2.
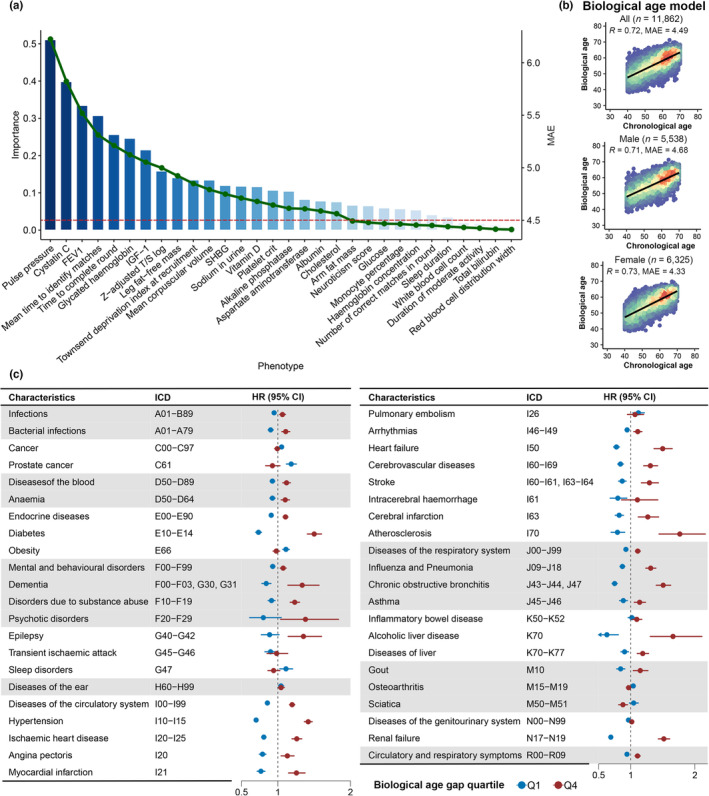
Predictor selection, performance, and implications of biological age. (a) The barplot showed the importance of phenotypes, which was the square root of the gain value generated from the LightGBM algorithm. The line chart showed the MAE when adding the phenotypes into the biological age model. (b) The scatter plot shows the distributions of biological age and chronological age of the participants. Each scatter indicated a single participant. The MAE and correlation coefficient of the model are shown in the left top part of the plot. (c) Associations of age gap with common health‐related outcomes. The forest plot shows the results of Cox proportional hazards regression analyses. Only the outcomes with nominally statistical significance (p < 0.05) are shown in the figure with the corresponding ICD‐10 codes. The Cox proportional model was adjusted for age at the recruitment, gender, ethnicity, education score, smoking status, alcohol drinking status, Townsend deprivation index, overall health rating, and number of medications/treatments taken. The second and the third quartiles of age gap (Q2 and Q3) are set as the reference, and other quartiles are marked with different colors. CI, confidence interval; HR, hazard ratio; ICD, international classification of diseases; IGF‐1, insulin growth factor; MAE, mean absolute error; SHBG, sex hormone binding globulin.