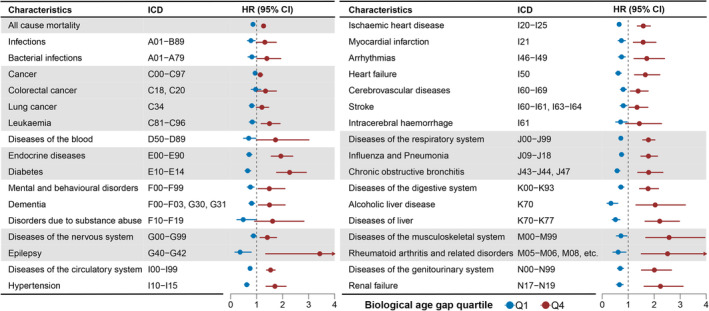
FIGURE 3.

Associations of age gap with all‐cause and cause‐specific mortality. The forest plot shows the results of Cox proportional hazards regression analyses. Only the outcomes with nominally statistical significance (p < 0.05) were shown in the figure with the corresponding ICD‐10 codes. The Cox proportional model was adjusted for age at the recruitment, gender, ethnicity, education score, smoking status, alcohol drinking status, Townsend deprivation index, overall health rating, and number of medications/treatments taken. The lowest quantile of age gap (Q1) is set as the reference, and other quantiles are marked with different colors. CI, confidence interval; HR, hazard ratio; ICD, international classification of diseases.
