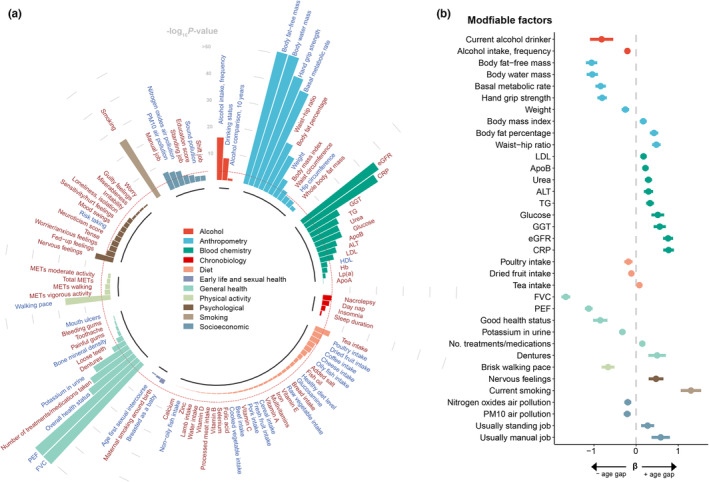
FIGURE 4.

The associations of the modifiable factors and biological age gap in healthy participants. (a) The circular barplot shows the associations of the modifiable factors with biological age gap. The association with a p‐value of <1 × 10−50 was rounded to 1 × 10−50. The red dashed line indicates the threshold of adjusted p‐value (4.81 × 10⁻⁴). The modifiable factors were filled with different colors based on the categories. The red text indicates positive associations with age gap (β > 0), and the light blue text indicated negative association with age gap (β < 0). (b) The forest plot showed the estimated effects of the factors significantly associated with biological age gap. The x‐axis indicates the β coefficient of the traits. The bar indicated the 95% CI. Continuous traits were estimated for 1‐SD increase in the trait. Binary traits were estimated as yes versus no. Good health status was compared with fair or poor. A brisk walking pace was compared with a steady or slow pace. Usually standing and manual jobs were compared with sometimes, rarely, or never. ALT, alanine aminotransferase; ApoA, apolipoprotein A; ApoB, apolipoprotein B; CRP, C‐reactive protein; eGFR, estimated glomerular filtration rate; FVC, forced vital capacity; GGT, gamma glutamyltransferase; Hb, hemoglobin concentration; HDL, high‐density lipoprotein cholesterol; LDL, low‐density lipoprotein cholesterol; Lp(a), lipoprotein A; MET, metabolic equivalent task; PEF, peak expiratory flow; PM10, particulate matter with diameter less than or equal to 10 micrometers; TG, triglycerides.
