
FIGURE 5.
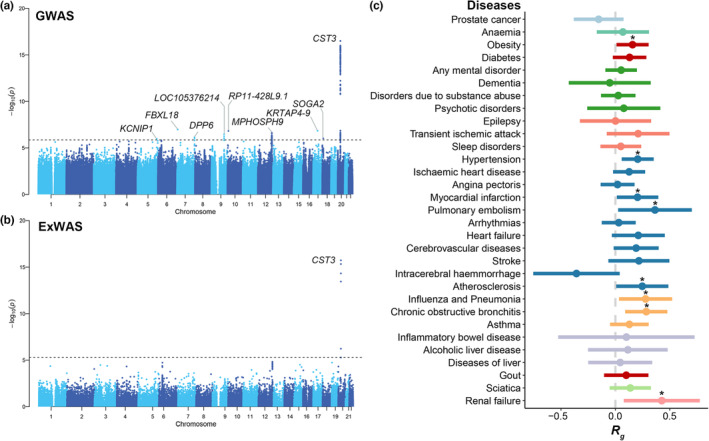
The genetic determinants and correlations of biological age gap. (a)The Manhattan plot shows the results of GWAS analysis of biological age gap in healthy participants. The y‐axis indicated the associations of the association of the locus with biological age gap. The loci with FDR < 0.05 were marked. (b) The Manhattan plot shows the results of ExWAS common variant analysis of biological age gap in healthy participants. The y‐axis indicated the associations of the association of the locus with biological age gap. The loci with FDR < 0.05 were marked. (c) The forest plot shows the results of LDSC analysis of biological age gap with the common health‐related outcomes that age gap was associated with the longitudinal survival analysis. The health‐related outcomes were filled with different colors based on the category. The outcomes that biological age gap nominally associated were marked with an asterisk. ExWAS, exomewide association study; GWAS, genome‐wide association study; LDSC, linkage disequilibrium score correlation.