
FIGURE 1.
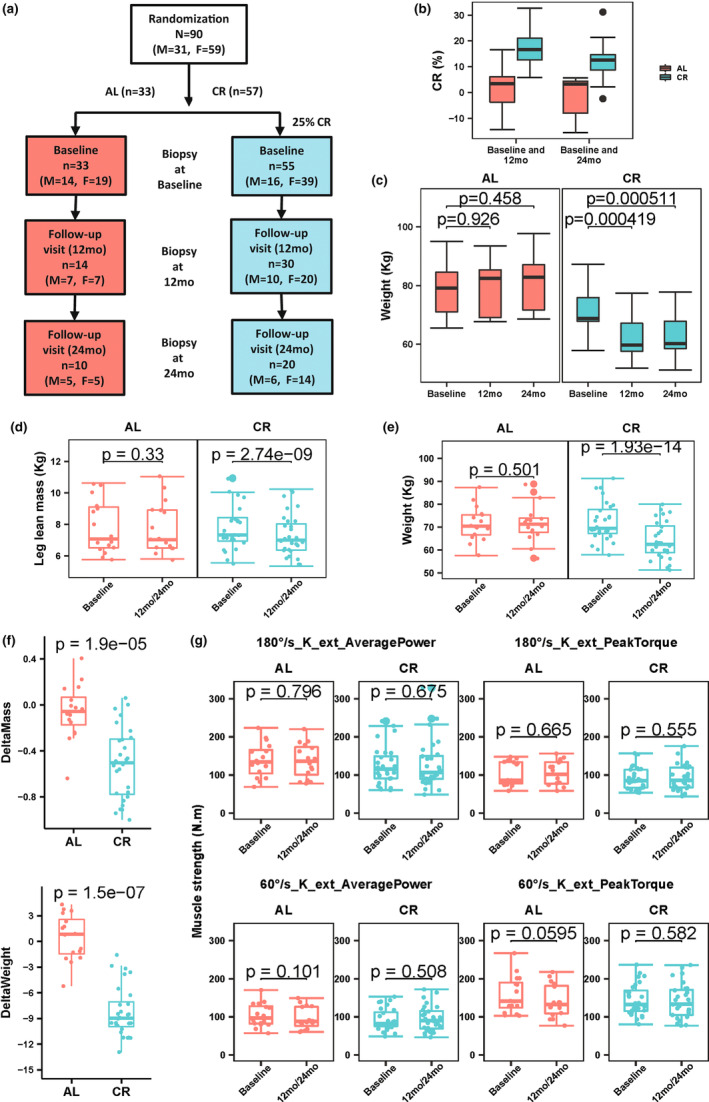
Flowchart for CALERIE participants who underwent muscle biopsies and percentage change of calorie intake and change of muscle mass, weight, and muscle strength in CR and AL. (a) The flow‐chart shows the 90 CALERIE participants randomly assigned to a CR and AL who underwent at least one muscle biopsy (baseline, 12‐month [12 mo], 24‐month [24 mo]). Of note, two individuals in the CR group underwent a muscle biopsy starting at the 12‐month follow‐up only. (b) Box plot showing percentage calorie intake reduction between baseline and 12‐month (n = 24 for CR group, n = 13 for AL group) as well as baseline and 24‐month (n = 17 for CR group, n = 7 for AL group) in CALERIE participants. (c) Boxplot showing weight at baseline (Ba), 12‐month follow‐up, and 24‐month follow‐up. Data presented are for participants who participated in muscle biopsy program at baseline and both follow‐up visit (n = 19 for CR group and n = 7 for AL group). Change of muscle mass (leg lean mass) (d) and weight (e) between baseline and 12‐month/24‐month for participants with muscle biopsy samples at baseline and at least one follow‐up visits at 12‐ or 24‐month (n = 27 for CR group and n = 15 for AL group). Analysis showed significant changes of muscle mass and weight in the CR group only (paired t‐test). (f) Changes of muscle mass and weight were significantly different between CR ad AL (unpaired, Wilcoxon test). (g) Comparison of muscle strength variables for knee extension (absolute average power and peak torque) in isokinetic dynamometry at 60 and 180°s−1 between baseline and 12‐month/24‐month (paired t‐test). There was no significant change in strength either in the CR and AL group.