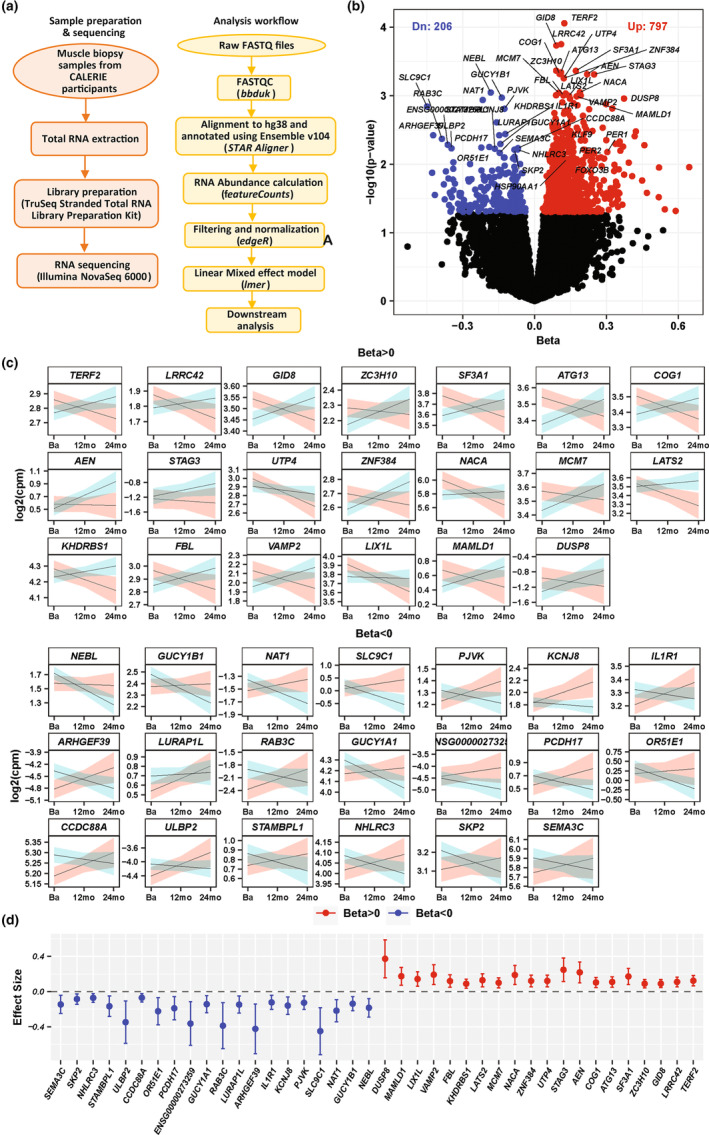
FIGURE 2.

Overview of analysis workflow and quantification of differentially expressed protein‐coding RNAs produced by linear mixed‐effects modeling (LMM) with linear time dependency. (a) A flow‐chart diagram depicting sample preparation and analysis workflow. (b) A Volcano plots depicting results of differential changes of gene expression between CR and AL using LMM and linear time. Red dot (positive beta: β+) represents genes whose differential expression is significantly increase in CR compared to AL over time; blue dot (for negative beta: β−) represents genes whose expression is significantly decreased in CR compared to AL over time. Some of the genes in each group (β+ and β−) were labeled. (c) Linear smooth trajectory (unadjusted) drawn with 95% confidence interval for the 20 top differentially expressed genes that became significantly overexpressed (left) and underexpressed genes (right) with time in CR compared to AL; in differentially trajectories, light blue colors are for CR and light red color are for AL; x‐axis represents three timepoints: baseline (Ba), 12‐month (12 mo), and 24‐month(24 mo), and y‐axis represents RNA expression (log2(CPM)). (d) Forest plot of top 40 transcripts showing range of beta coefficient (β) (20 with β+ and 20 with β−) and standard errors.
