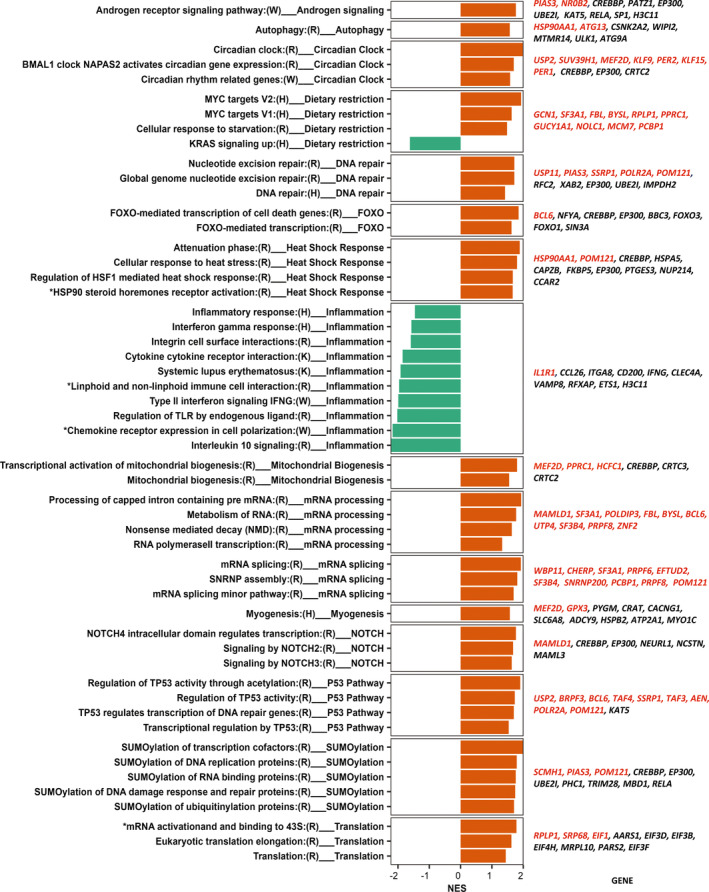
FIGURE 3.

Selected significantly enriched pathways (p‐adj <0.05) obtained by ranked based gene set enrichment analysis. Genes were ranked by p‐value for the effect of CR compared to AL on differential expression change over time. The left column shows enriched pathways from four databases (H: Hallmark, R: Reactome, K: KEGG, and W: WikiPathways) followed by functional pathways domain. The middle column shows normalized enrichment score (NES) for each pathway (red upregulated pathways in CR and green downregulated pathways in CR). The last column reports up to 10 top significant genes (based on p‐value) in each domain, with red font indicating p < 0.01 and black font indicating 0.01 < p < 0.5. Star (*) symbol indicate that short name of the pathway was used for illustration purpose, full name can be seen in Table S4.
