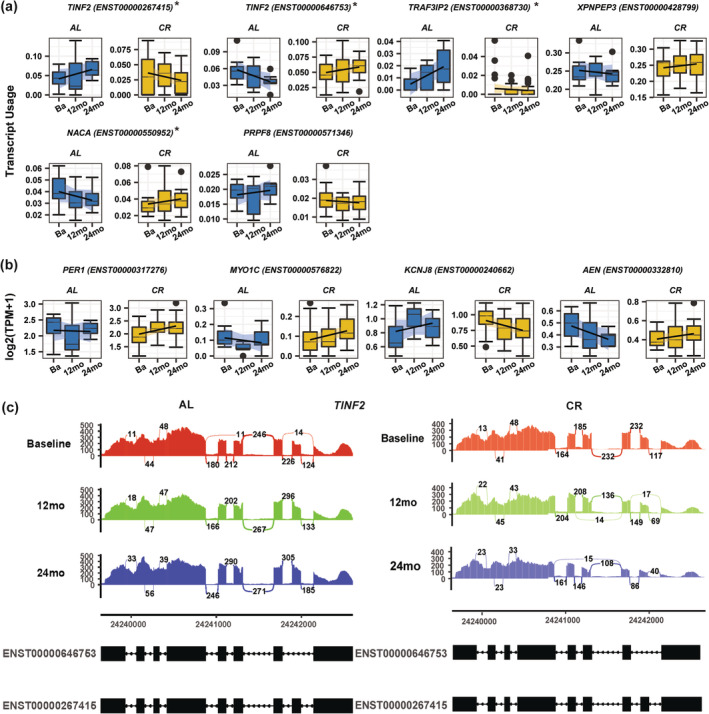
FIGURE 6.

Differentially transcript expression change and/or differentially transcript usage changes of twelve mRNA splicing variants over time between CR and AL. Examples of splicing variants identified as showing significant differential expression changes/usage at p < 0.01 between CR and AL over time (baseline (Ba), 12‐month [12 mo], and 24‐month [24 mo]) in both Kallisto and RSEM analyses. Figure showed differentially expressed change supported transcripts in (a) and differentially usage change supported transcripts in (b) for completer group. Star (*) symbol in differentially usage supported transcripts was also supported in differentially expression analysis. Both differentially transcript expression (in log2(TPM + 1)) and differentially transcript usage (normalized by log2(TPM + 1) per RNA in 0–1 scale) changes were shown for Kallisto quantification approach and. (c) Sashimi plot (shown for one sample) representing junction count for two alternate splice variants of TINF2 separately for AL and CR group. Important junction is where the exon‐skipping event is occurring. For CR group, junction count value decreases over time at 12 and 24 months compared to baseline whereas as for AL group, value almost unchanged or little increasing in 12 and 24 months compared to baseline.
