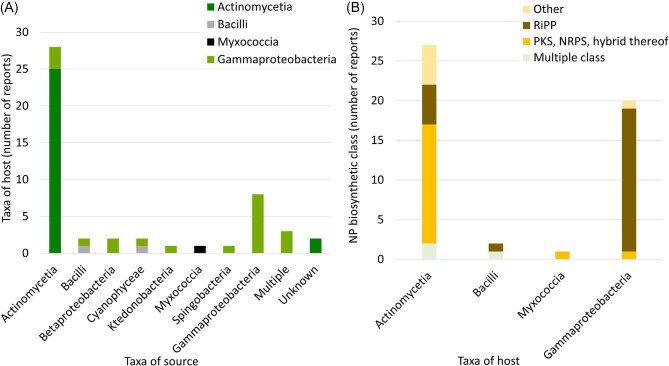
Fig. 4.
Metrics regarding source taxa, host taxa, and biosynthetic class. (A) Relationship between the taxa of the BGC source (x-axis) and the taxa of the heterologous host (y-axis). Studies that tested more than one source taxa were labeled as multiple. Host taxa (class) are color-coded as indicated. (B) Relationship between the taxa of the host used (x-axis) and the biosynthetic class of the expressed BGC (y-axis). NP biosynthetic classes are color coded as indicated.

