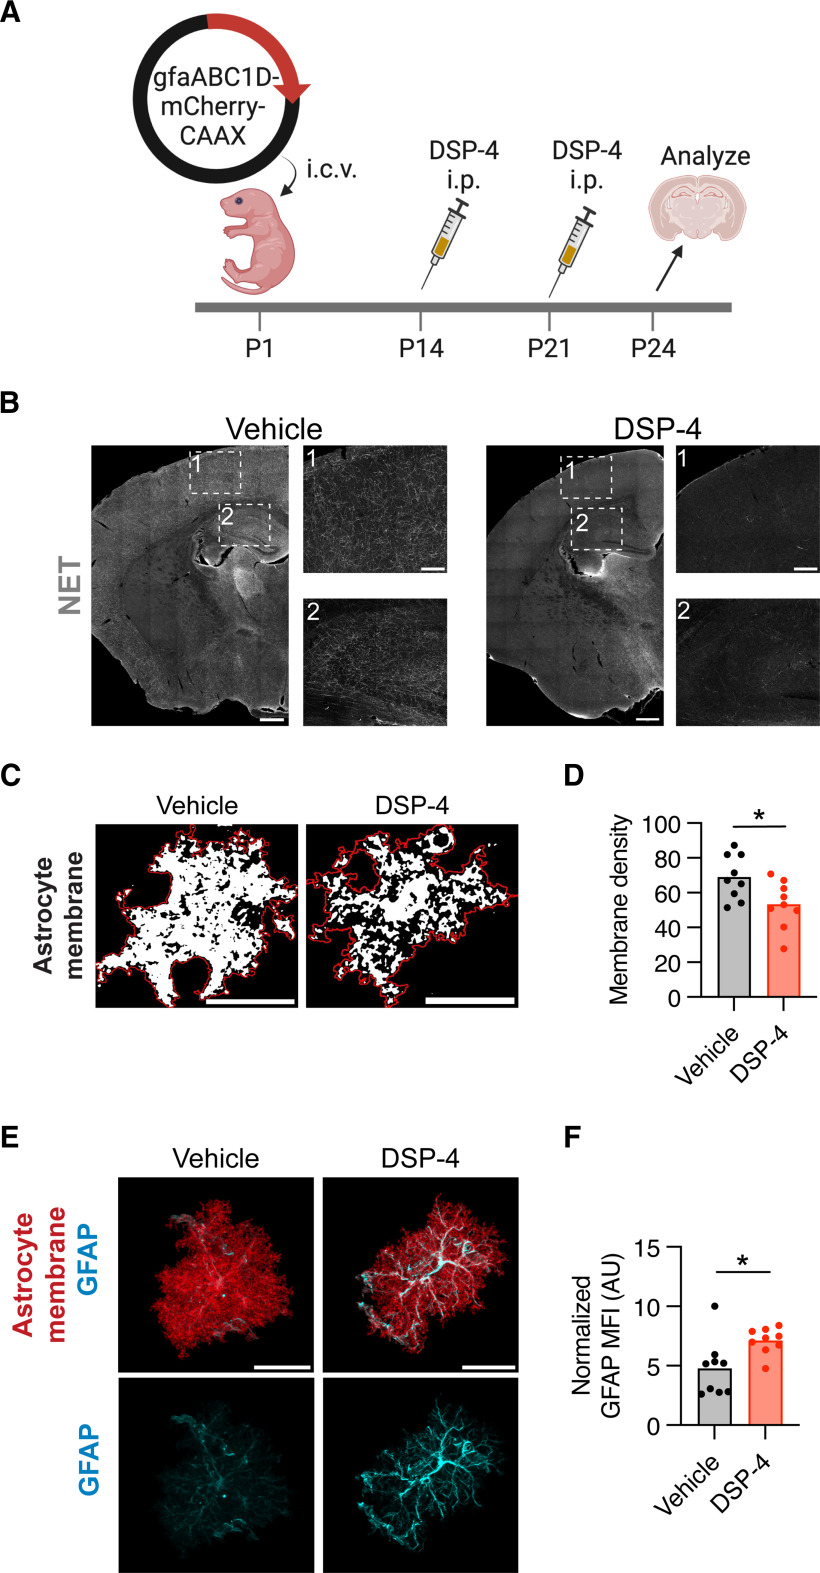
Figure 2.
Early postnatal ablation of NE reduces astrocyte morphologic complexity. A, Experimental timeline for astrocyte sparse labeling by plasmid electroporation at P1 followed by DSP-4-mediated NE ablation at P14-P21. B, Representative images illustrating extent of NE projection ablation at P25 following intraperitoneal injection of DSP-4 at P5. Insets: (1) cortex; (2) hippocampus. Scale bars: coronal brain hemi-sections, 500 μm; insets, 150 μm. C, Representative images of thresholded cortical astrocyte single optical sections from vehicle and DSP-4-treated conditions. Red line indicates the perimeter of the cell. White thresholded signal represents the astrocyte membrane enclosed within the perimeter. Scale bar, 25 μm. D, Quantification of cortical astrocyte membrane density, defined as the percent of the astrocyte's cross-sectional area covered by plasma membrane. Statistics: two-tailed, unpaired t test (t(16) = 2.521, *p = 0.0227). Data points are individual cells, 9 cells (3 mice) per condition. E, Representative images of per-cell GFAP intensity after DSP-4 treatment. Images represent the masked mCherry-CAAX (red) and GFAP (cyan) signal from an Imaris surface reconstruction of a single cortical astrocyte. Scale bar, 25 μm. F, Quantification of normalized GFAP intensity (normalized to mCherry signal). AU, Arbitrary units. Statistics: Mann–Whitney test (U(16) = 13, *p = 0.0142). Data points are individual cells, 9 cells (3 mice) per condition.

