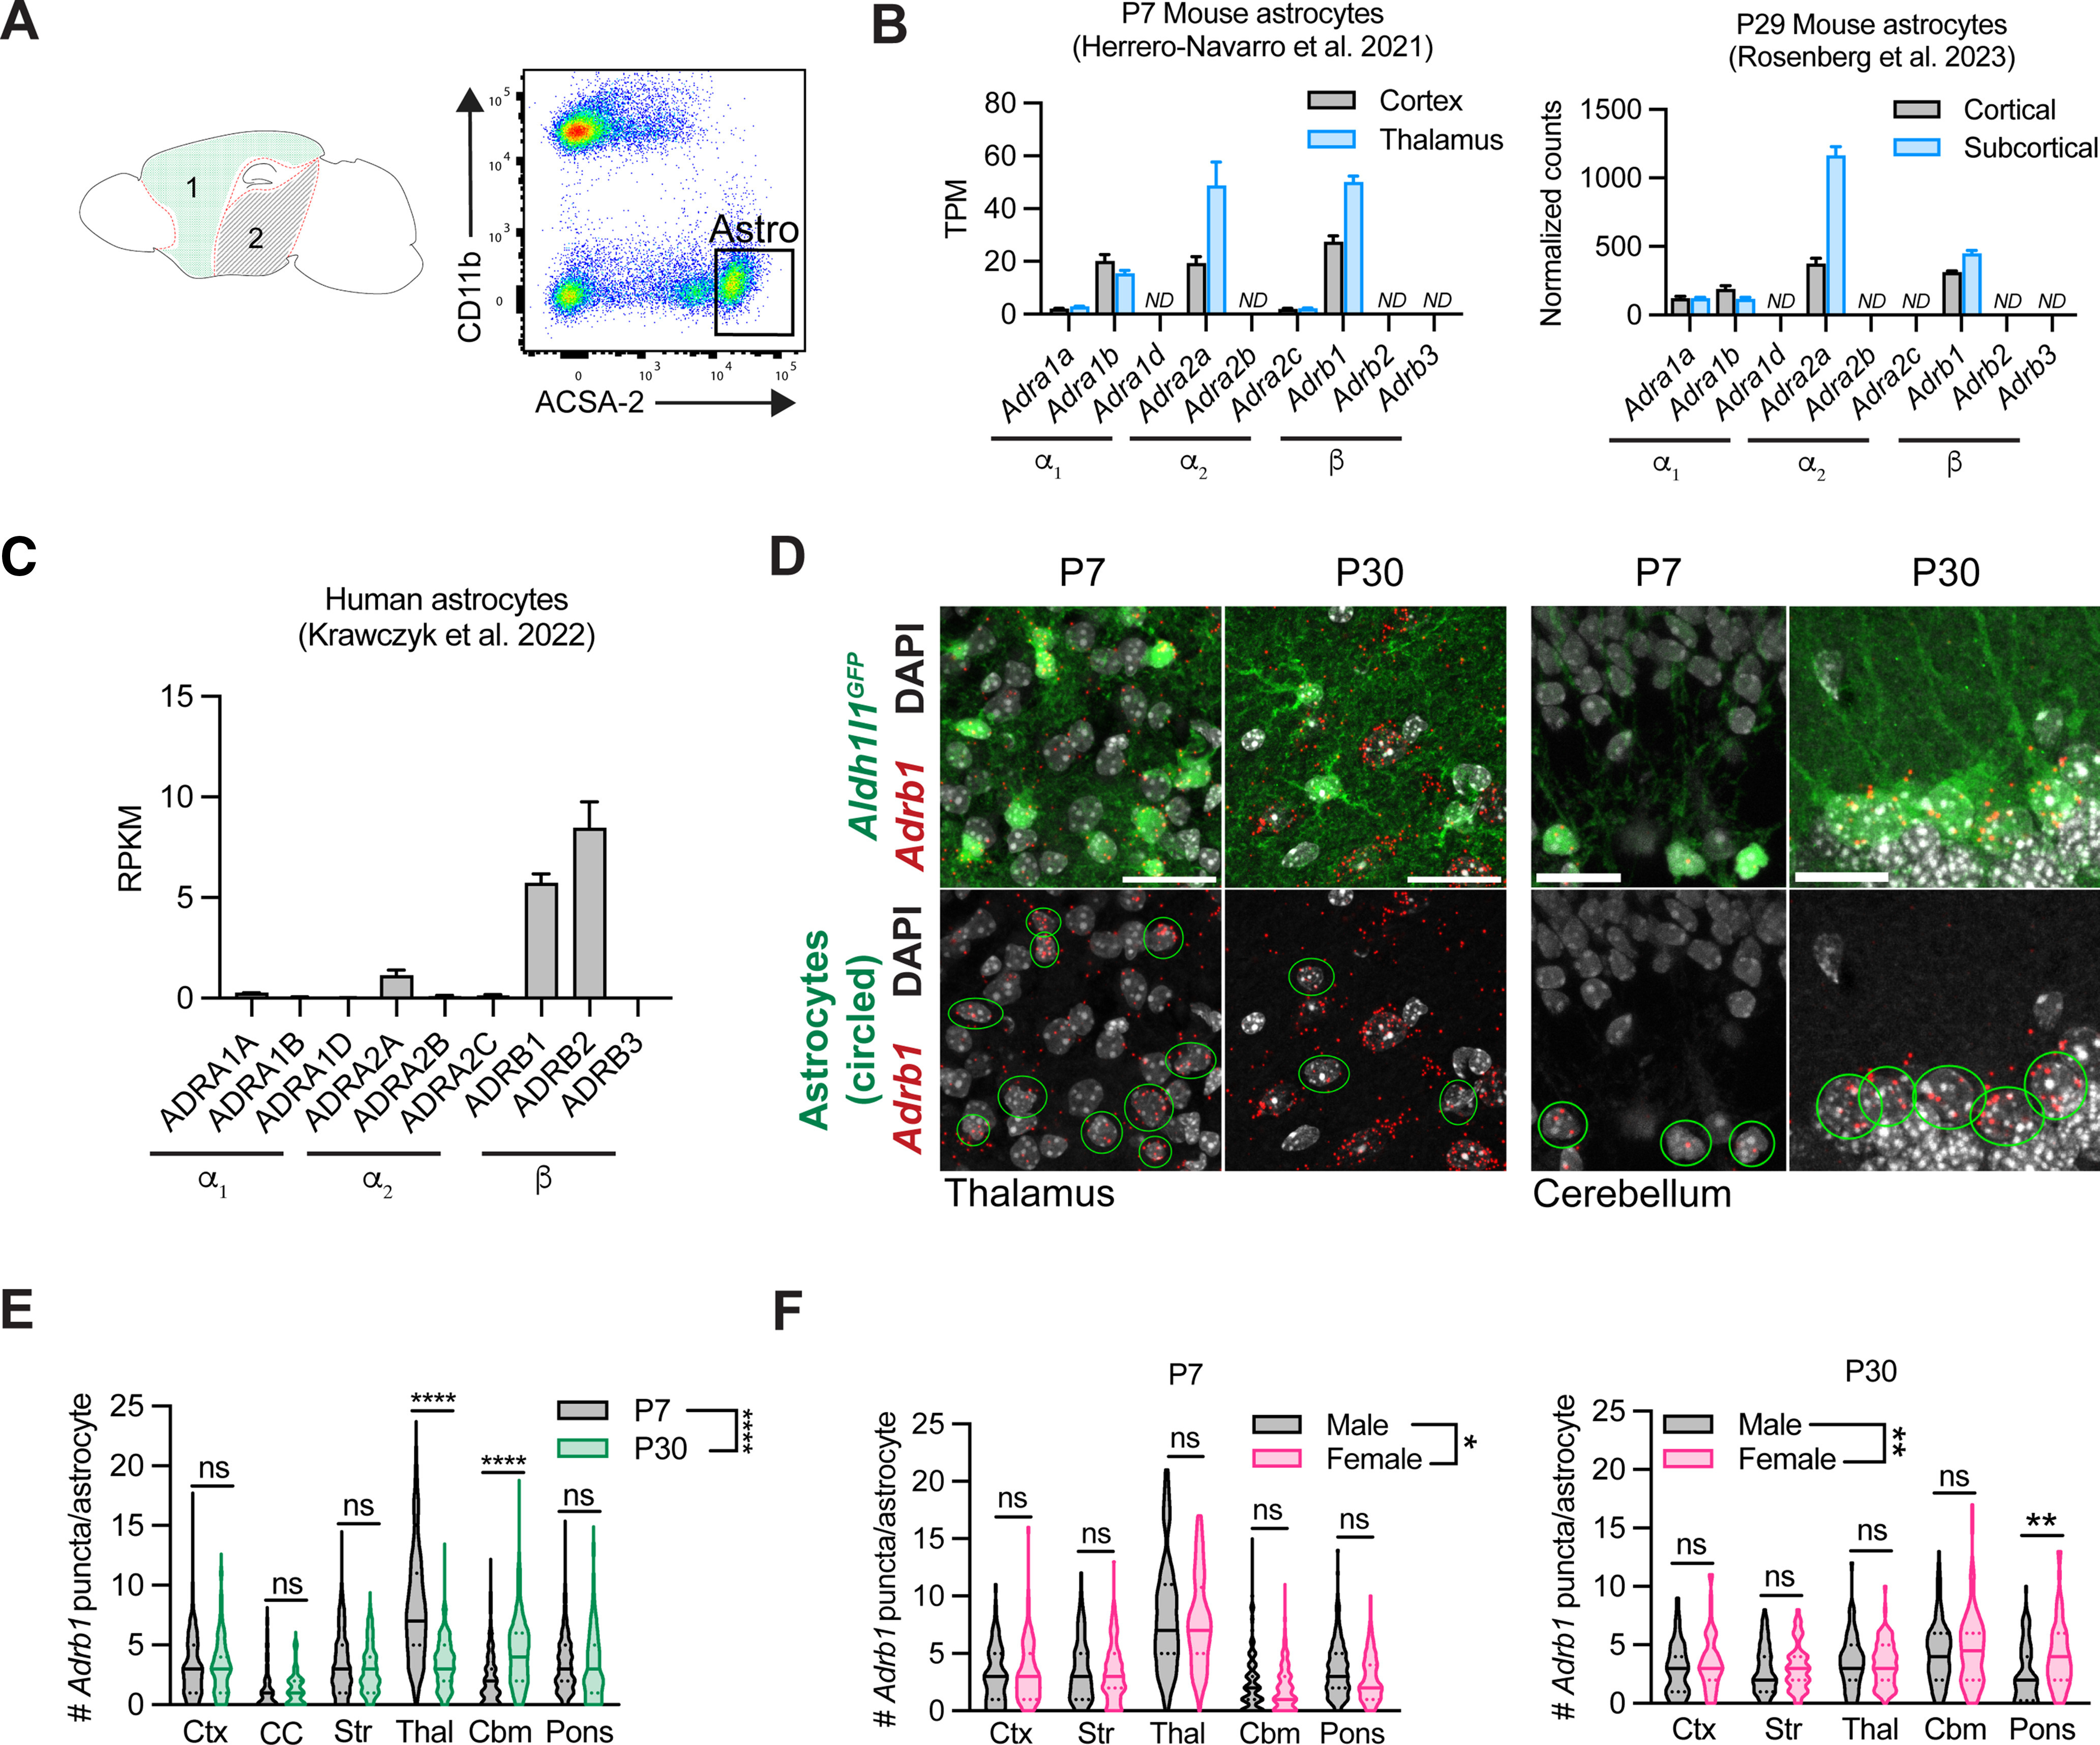
Figure 3.

Profiling of astrocytic adrenergic receptors in mouse and human. A, Schematic of regions dissected from P29 mouse brain for astrocyte RNA sequencing and representative flow plots of ACSA-2+ astrocytes isolated from cortical tissue. 1, cortical; 2, subcortical. B, Adrenergic receptor expression in P7 (Herrero-Navarro et al., 2021) and P29 murine astrocytes isolated from cortical versus subcortical tissue of mouse. ND, Not detected. For the P7 dataset, gene expression is represented by transcripts per million (TPM) counts. Data are mean ± SEM, 4 mice per region. For the P29 dataset, counts normalized to per-sample library size. Data are mean ± SEM, 4 mice per region. C, Adrenergic receptor expression in human cortical astrocytes. RPKM, reads per kilobase of transcript per million mapped reads. Data are mean ± SEM, 12 samples. D, Representative images of Adrb1 expression in astrocytes at P7 versus P30 in thalamus and cerebellum. Scale bars: thalamus, 25 μm; cerebellum, 15 μm. E, Quantification of per-astrocyte Adrb1 expression at P7 versus P30, across multiple brain regions. Ctx, Cortex; CC, corpus callosum; Str, striatum; Thal, thalamus; Cbm, cerebellum. Statistics: two-way ANOVA with Sidak's multiple comparisons (two-way ANOVA, region × age, F(1, 2431) = 12.054, p = 0.0005; multiple comparisons, each between P7 versus P30, Ctx, ns, p > 0.9999; CC, ns, p > 0.9999; Str, ns, p = 0.5836; Thal, ****p < 0.0001; Cbm, ****p < 0.0001, Pons, ns, p = 0.9996). Data are median ± interquartile range (violin plots), plotted by cell, 4-6 mice per time point (P7 Ctx, n = 163 cells; P30 Ctx, n = 111 cells; P7 CC, n = 91 cells; P30 CC, n = 62 cells; P7 Str, n = 324 cells; P30 Str, n = 137 cells; P7 Thal, n = 251 cells; P30 Thal, n = 143 cells; P7 Cbm, n = 482 cells; P30 Cbm, n = 263 cells; P7 Pons, n = 271 cells; P30 Pons, n = 145 cells). F, Quantification of per-astrocyte Adrb1 expression in males versus females at P7 and P30, across multiple brain regions. Ctx, cortex; Str, striatum; Thal, thalamus; Cb, cerebellum. P7 statistics: two-way ANOVA with Sidak's multiple comparisons (two-way ANOVA, region × sex, F(1,1542) = 3.989, *p = 0.0460; multiple comparisons, each between M versus F, Ctx, ns, p = 0.9935; Str, ns, p = 0.9380; Thal, ns, p = 0.7225; Cbm, ns, p = 0.4922; Pons, ns, p = 0.1999). Data are median ± interquartile range (violin plots), plotted by cell, 3 mice per sex (M P7 Ctx, n = 74 cells; F P7 Ctx, n = 89 cells; M P7 Str, n = 162 cells; F P7 Str, n = 162 cells; M P7 Thal, n = 134 cells; F P7 Thal, n = 116 cells; M P7 Cbm, n = 288 cells; F P7 Cbm, n = 256 cells; M P7 Pons, n = 169 cells; F P7 Pons, n = 102 cells). P30 statistics: two-way ANOVA with Sidak's multiple comparisons (two-way ANOVA, region × sex, F(1790) = 7.958, **p = 0.0049; multiple comparisons, each between M versus F, Ctx, ns, p = 0.6832; Str, ns, p = 0.9943; Thal, ns, p > 0.9999; Cbm, ns, p = 0.7845; Pons, **p = 0.0012). Data are median ± interquartile range (violin plots), plotted by cell, 3 mice per sex (M P30 Ctx, n = 55 cells; F P30 Ctx, n = 56 cells; M P30 Str, n = 80 cells; F P30 Str, n = 57 cells; M P30 Thal, n = 69 cells; F P30 Thal, n = 74 cells; M P30 Cbm, n = 128 cells; F P30 Cbm, n = 136 cells; M P30 Pons, n = 80 cells; F P30 Pons, n = 65 cells).
