Figure 4.

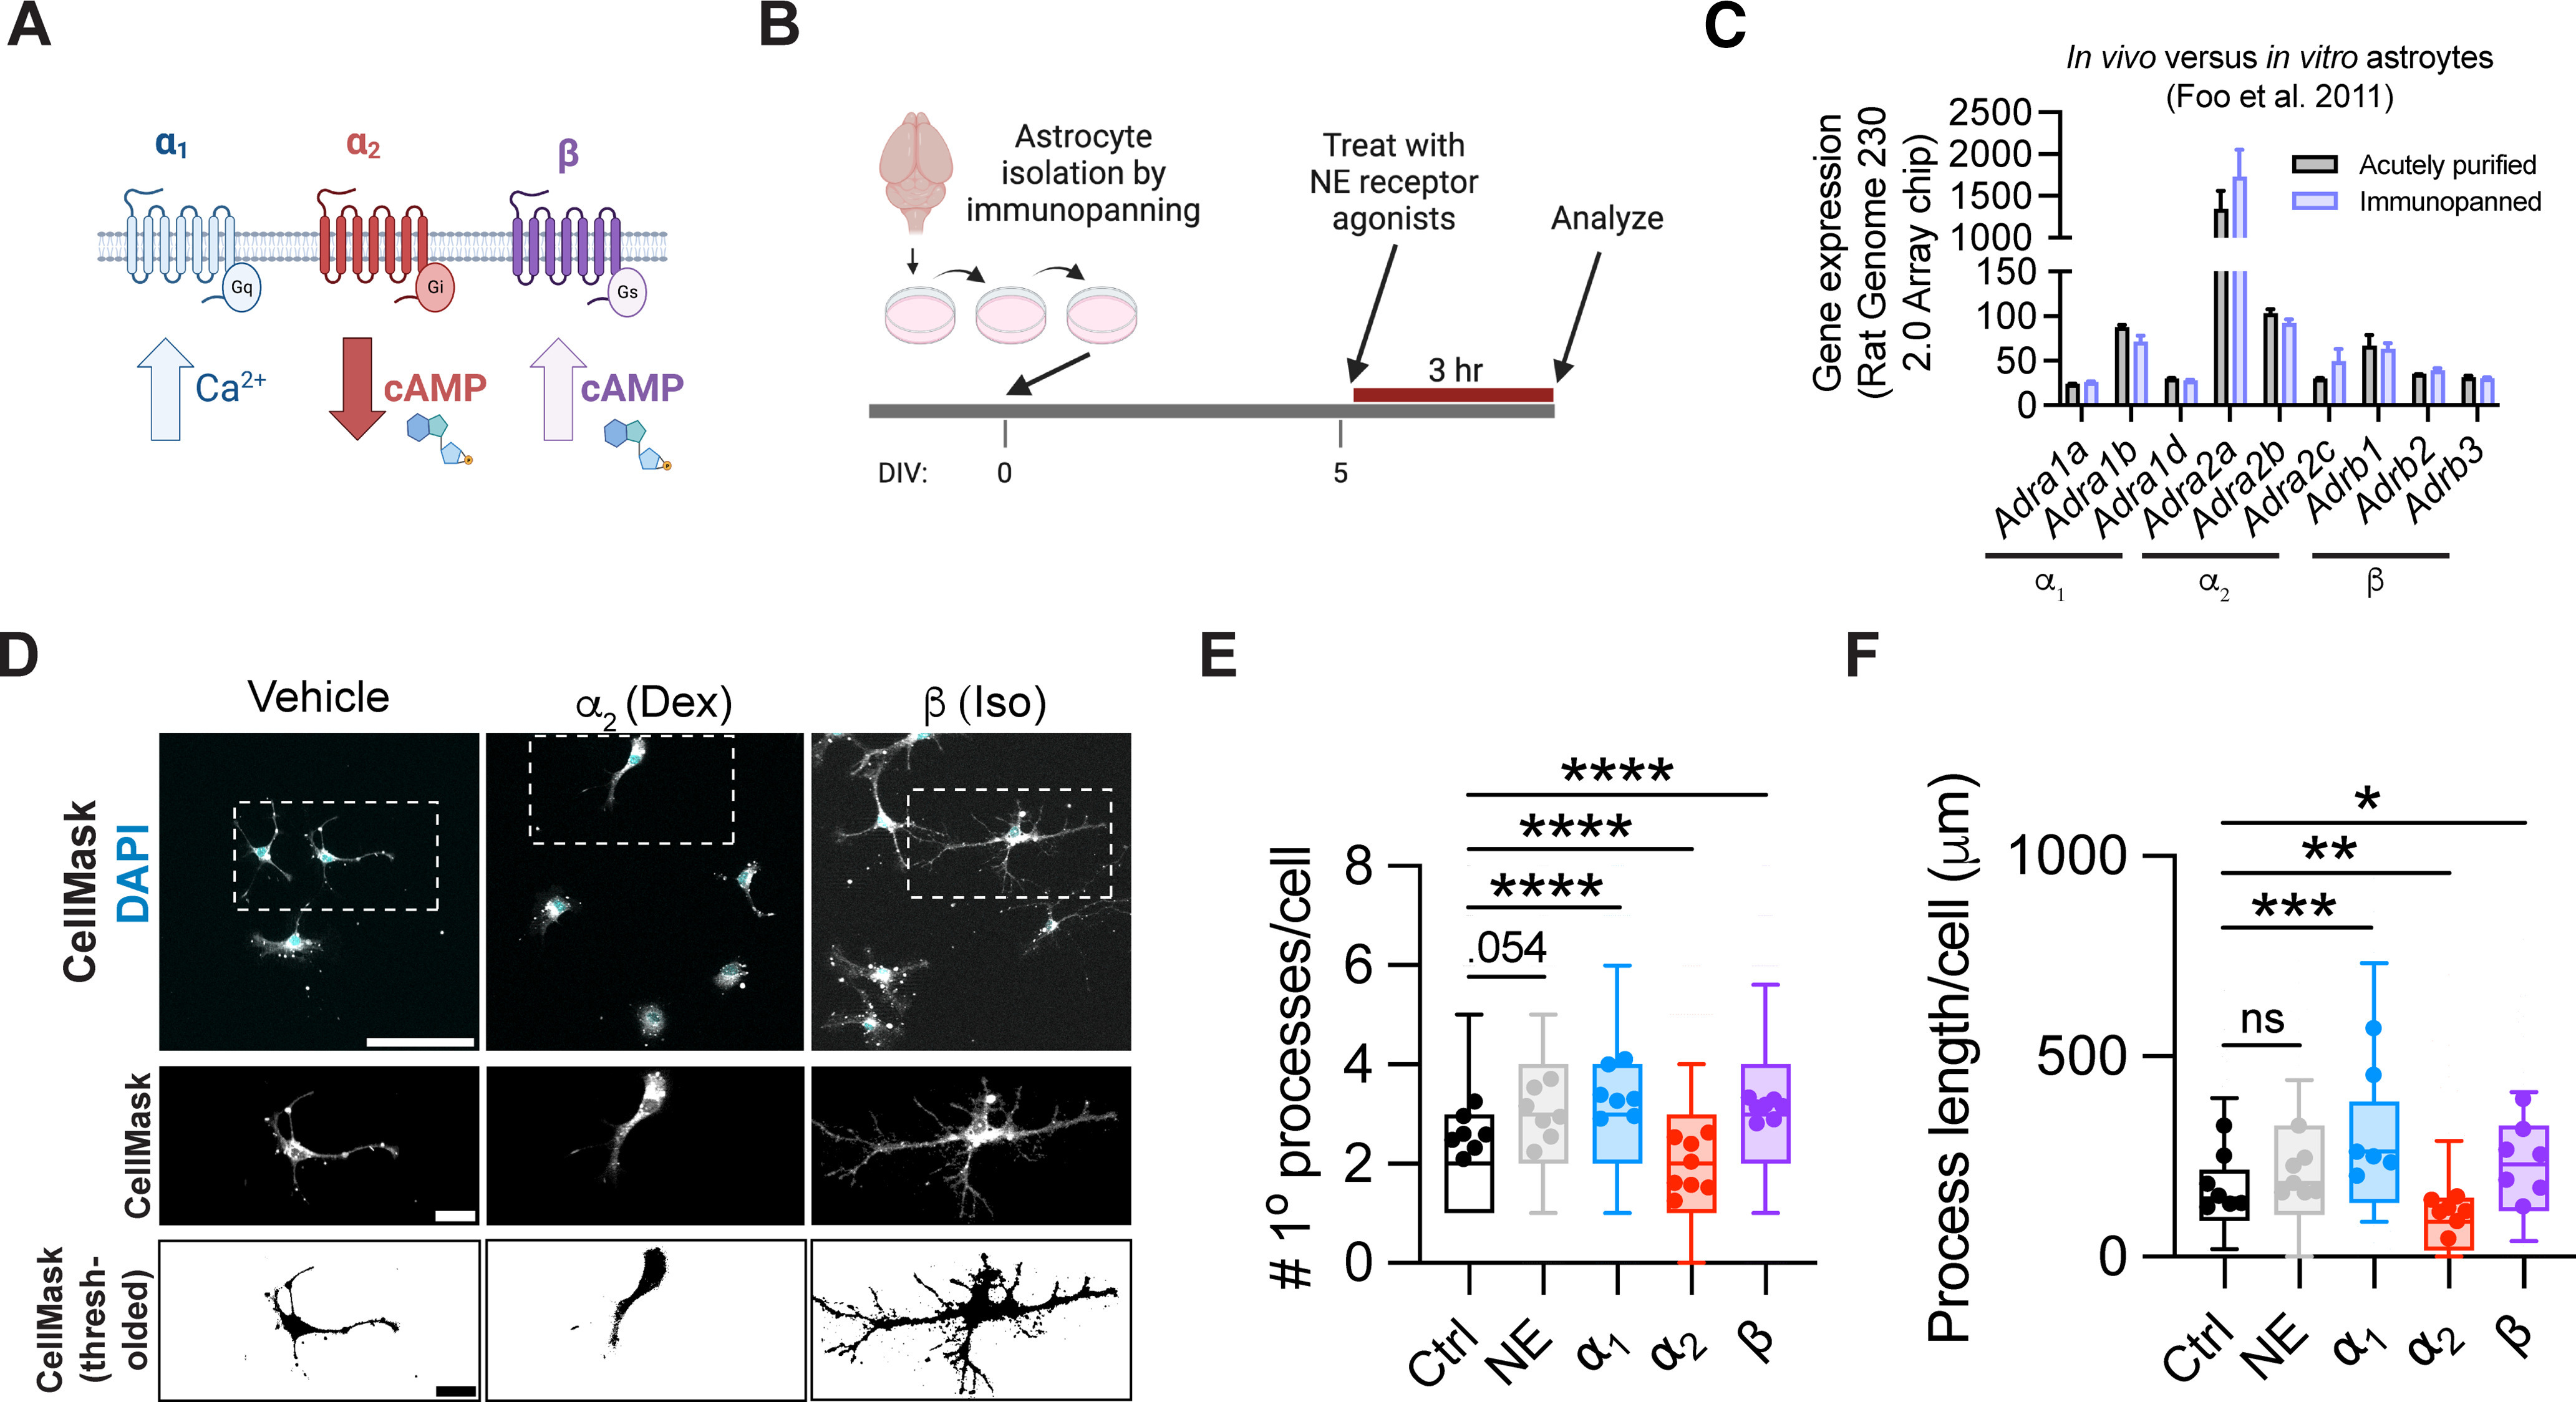
β and α2 signaling have opposing effects on astrocyte branching in vitro. A, Schematic of three different subclasses of adrenergic GPCRs. B, Schematic of experimental design, based on rat cortical astrocytes purified by serial immunopanning. C, Adrenergic receptor gene expression in acutely purified versus immunopanned rat astrocytes, as reported off of an Affymetrix Rat Genome 230 2.0 Array chip (Foo et al., 2011). D, Representative images of immunopanned astrocytes treated with adrenergic receptor subtype-specific agonists. First row, raw image; second row, inset of individual cells; third row, thresholding of individual cells. Scale bars: first row, 100 μm; second row, 25 μm; third row, 25 μm. Dex, Dexmedetomidine; Iso, isoproterenol. E, Quantification of astrocyte primary process count per cell 3 h after addition of the indicated agonists. List of agonists (all administered at 1 μm): NE; α1, phenylephrine; α2, dexmedetomidine, β, isoproterenol. Statistics: Kruskal–Wallis test with Dunn's multiple comparisons test, run on per-cell data (H(1600) = 157.8, p < 0.0001; multiple comparisons, each between drug treatment and control, NE, ns, p = 0.0537; α1, ****p < 0.0001; α2, ****p < 0.0001, β, ****p < 0.0001). Data are median ± interquartile range (box and whiskers plot) with whiskers extending from 10th-90th percentile, plotted by cell, from 7 or 8 wells across 3 batches (Ctrl, n = 298 cells; NE, n = 298 cells; α1 = 288 cells; α2 = 368 cells; β = 353 cells). Per-well averages are superimposed on top of each box and whisker plot. F, Quantification of total length of all astrocyte processes per cell, 3 h after addition of indicated agonists (same as in E). Statistics: Kruskal–Wallis test with Dunn's multiple comparisons test, run on per-cell data (H(482) = 70.14, p < 0.0001; multiple comparisons, each between drug treatment and control, NE, ns, p = 0.2004; α1, ***p = 0.0002; α2, **p = 0.0012, β, *p = 0.0207). Data are median ± interquartile range (box and whiskers plot) with whiskers extending from 10th-90th percentile, plotted by cell, from 6 or 7 wells across 3 batches (Ctrl, n = 107 cells; NE, n = 95 cells; α1 = 68 cells; α2 = 109 cells; β = 108 cells). Per-well averages are superimposed on top of each box and whisker plot.
