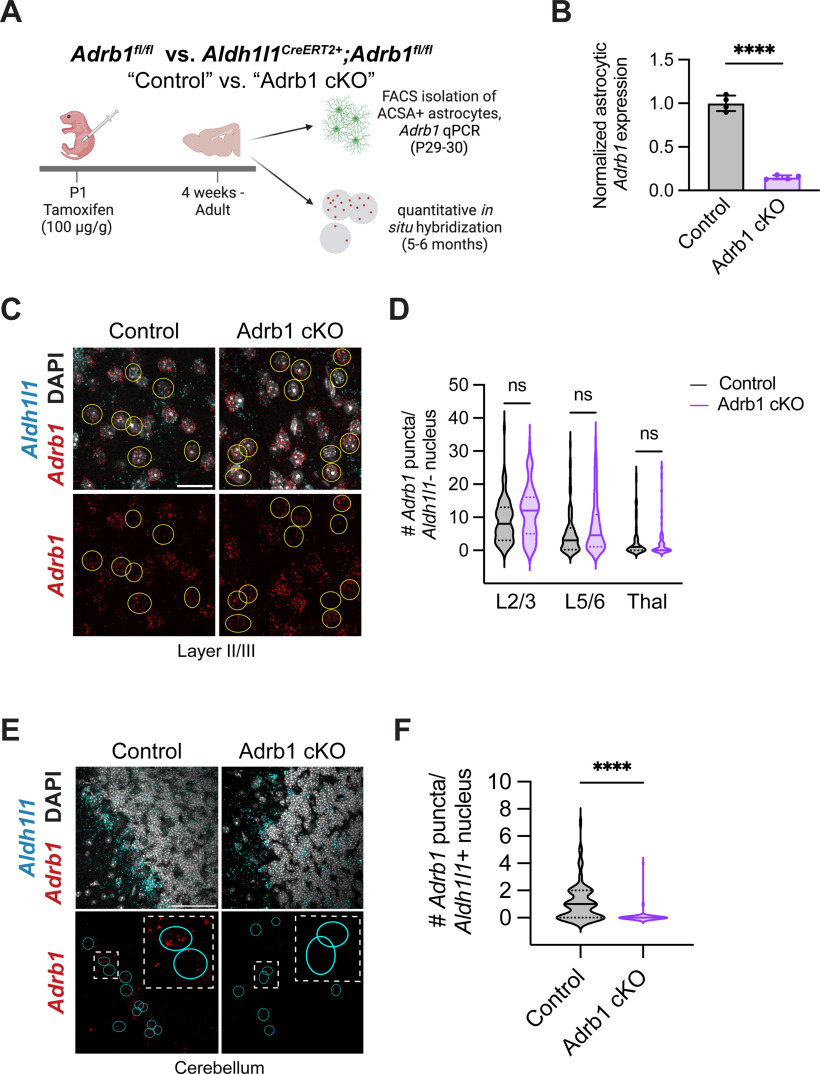
Figure 5.
Astrocyte-specific deletion of the β1-adrenergic receptor in neonatal mice. A, Schematic for conditional deletion of Adrb1 in astrocytes and validation of sensitivity and specificity. B, Astrocytic Adrb1 expression in astrocytes isolated from control (Adrb1fl/fl) versus Adrb1 cKO (Aldh1l1CreERT2+Adrb1fl/fl) brains, as measured by qPCR, and normalized to astrocyte marker gene Aldh1l1. Dots represent individual animals. Statistics: two-tailed unpaired t test (t(6) = 18.40, ****p < 0.0001). Data are mean ± SD. C, Representative images of Adrb1 fluorescent ISH in cortex of control versus Adrb1 cKO brains. Yellow circles outline nonastrocytic soma, around which perinuclear puncta were quantified. Scale bar, 25 μm. D, Quantification of Adrb1 puncta in nonastrocytes of control versus Adrb1 cKO animals in cortex and thalamus. L2/3, layer II/III cortex; L5/6, layer V/VI cortex; Thal, thalamus. Statistics: Welch's ANOVA with Dunnett's T3 multiple comparisons (W(5, 209.3) = 18.82, p < 0.0001; multiple comparisons, each between genotypes per region, L2/3, ns, p =0.1286; L5/6, ns, p = 0.2264, Thal, ns, p = 0.9722). Data are median ± interquartile range (violin plots), plotted by cell, 3 or 4 mice per genotype (L2/3 Control, n = 81 cells; L2/3 Adrb1 cKO, n = 80 cells; L5/6 Control, n = 80 cells; L5/6 Adrb1 cKO, n = 80 cells; Thal Control, n = 80 cells; Thal Adrb1 cKO, n = 60 cells). E, Representative images of Adrb1 expression in cerebellar astrocytes of control versus Adrb1 cKO animals. Cyan circles outline Aldh1l1+ astrocytes. Scale bar, 50 μm. F, Quantification of per-cell Adrb1 puncta in cerebellar astrocytes of control versus Adrb1 cKO animals. Statistics: Mann–Whitney test (U(147) = 1257, ****p < 0.0001). Data are median ± interquartile range (violin plots), plotted by cell, 4 mice per genotype (Control, n = 82 cells; Adrb1 cKO, n = 67 cells).

