Figure 6.

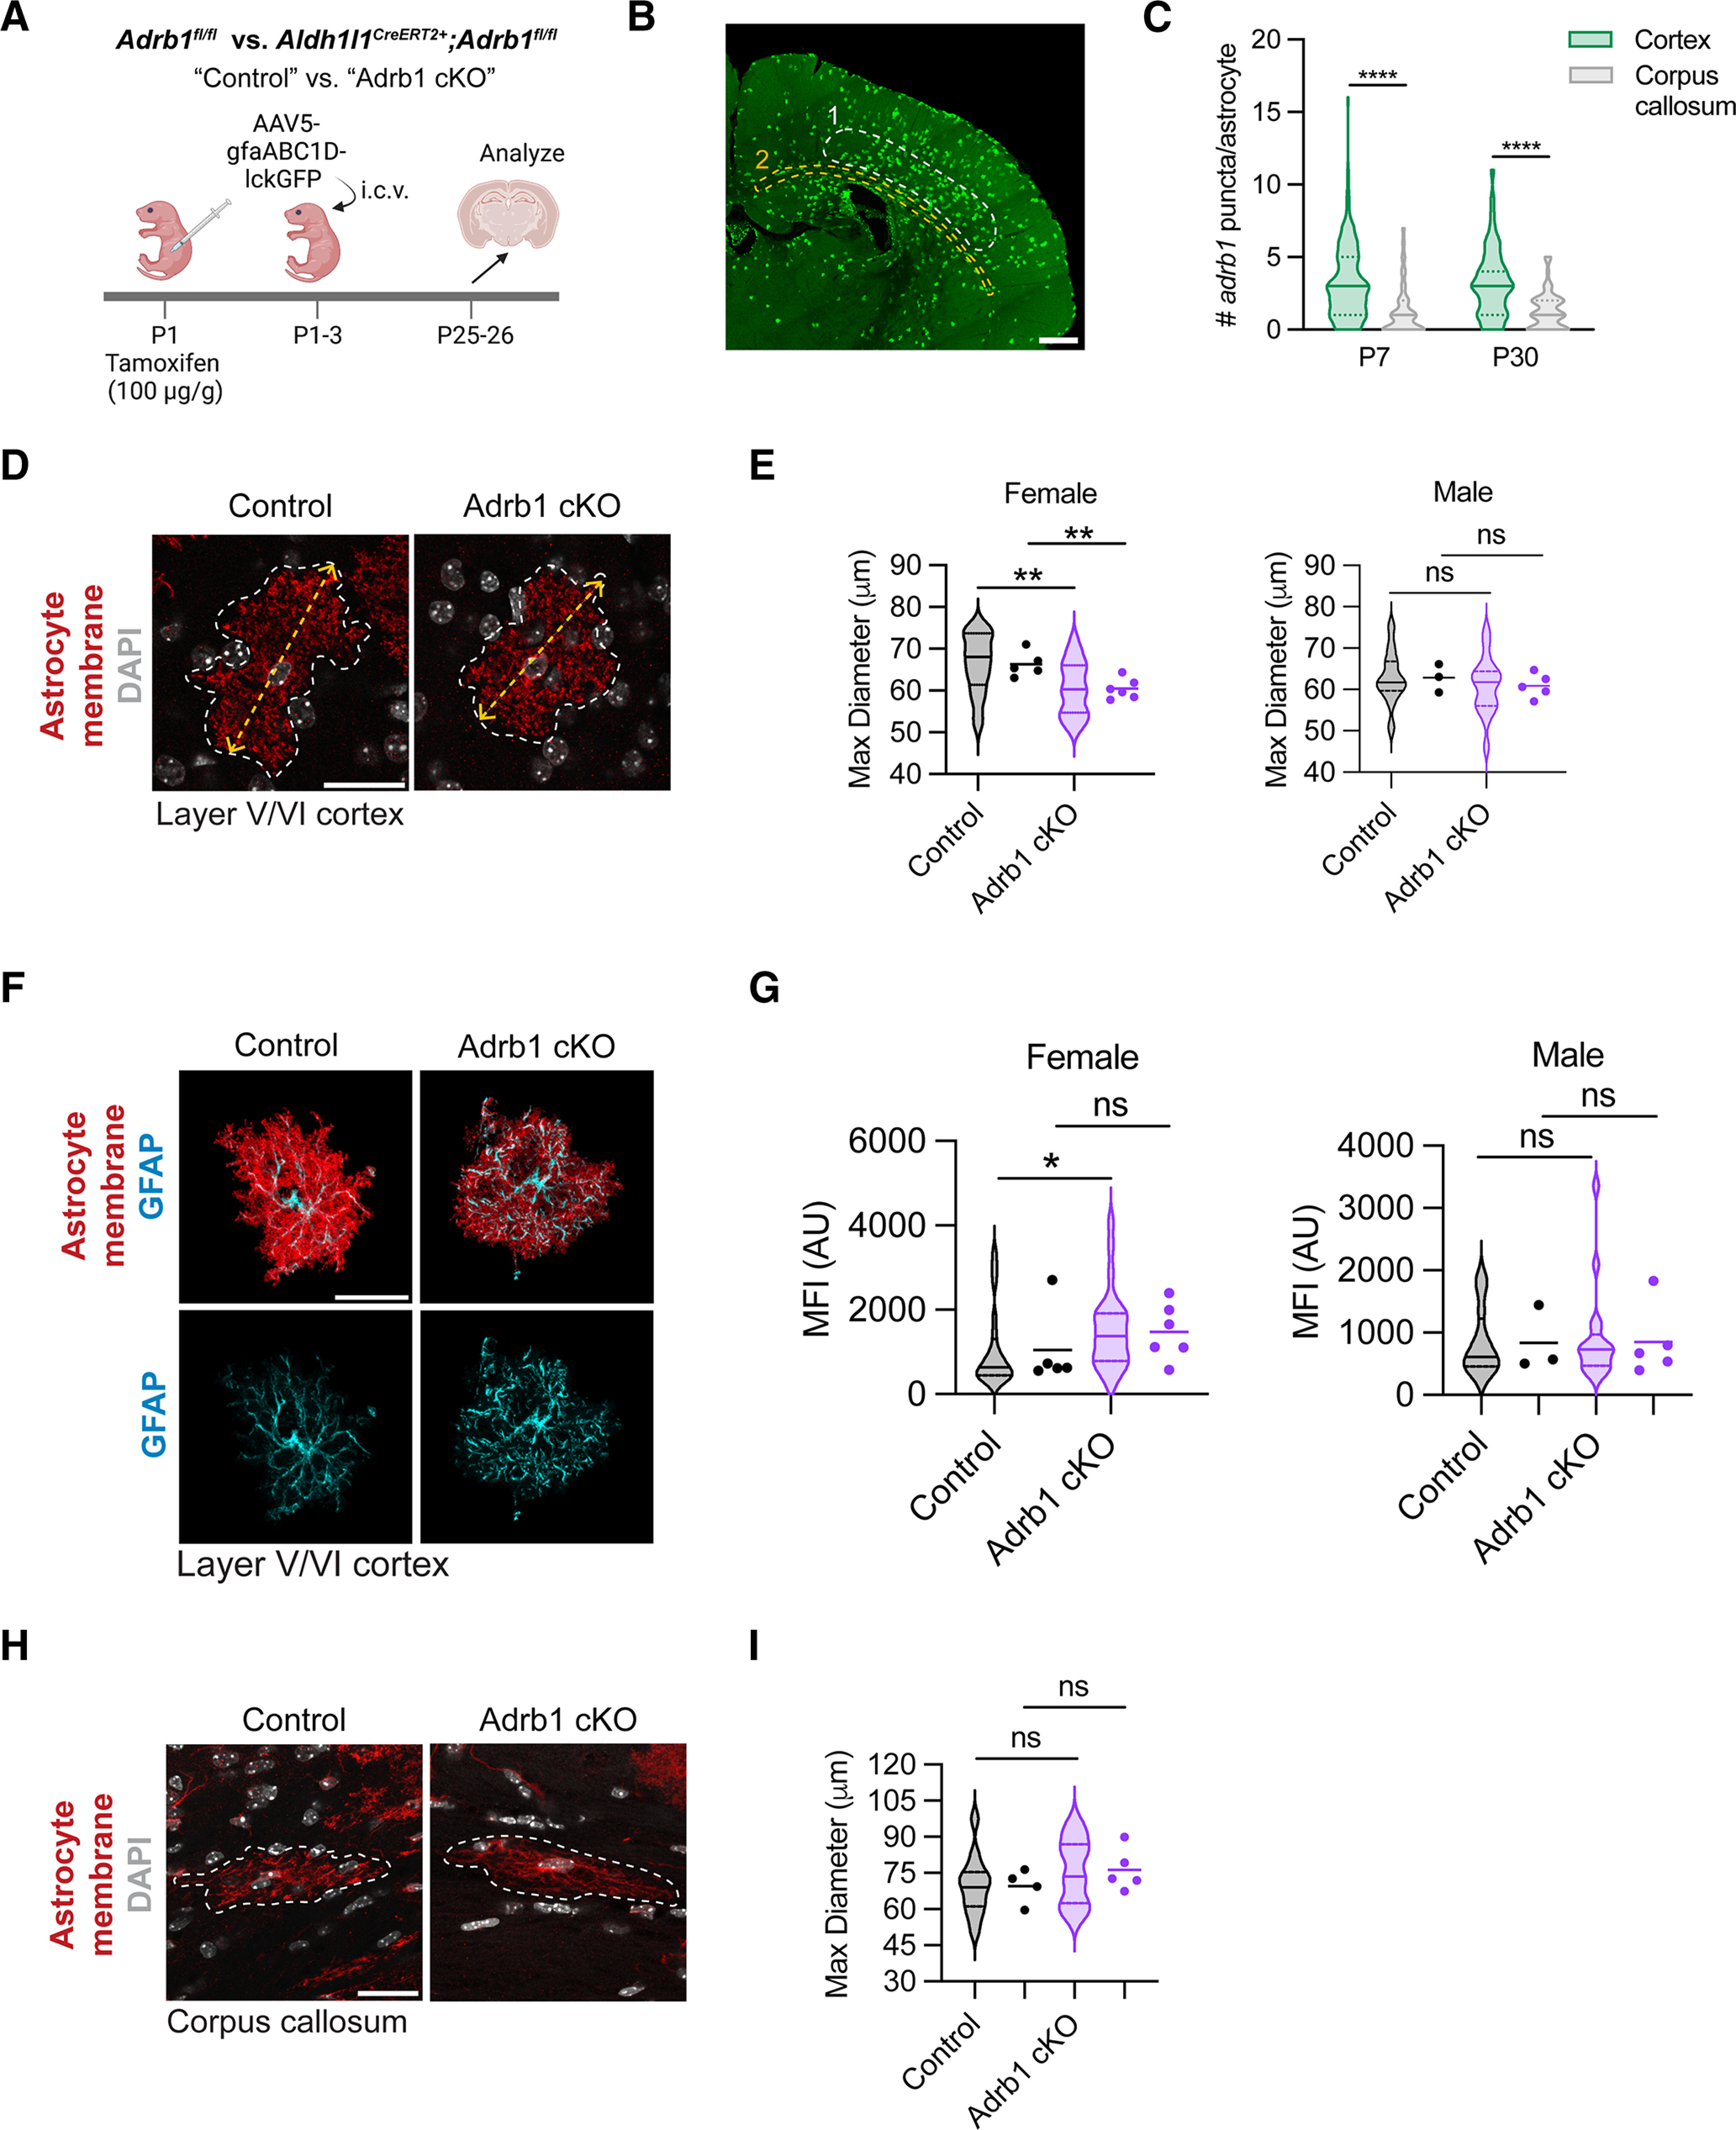
Noradrenergic signaling through the astrocytic β1-adrenergic receptor increases gray matter astrocyte size in female mice. A, Schematic of astrocyte sparse labeling experimental paradigm in control or Adrb1 cKO littermates. B, Representative image of sparse astrocyte labeling with AAV5-gfaABC1D-lckGFP reporter virus, with ROIs analyzed highlighted with dotted circles. 1, layer V/VI of somatosensory cortex; 2, corpus callosum. Scale bar, 500 μm. C, Quantification of per-astrocyte Adrb1 expression at P7 versus P30, in gray matter (cortex) versus white matter (corpus callosum). P7 statistics: Mann–Whitney test (U(252) = 3566, ****p < 0.0001). P30 statistics: Mann–Whitney test (U(171) = 1631, ****p < 0.0001). D, Representative images of cortical astrocytes in control or Adrb1 cKO littermates. Yellow dashed arrow indicates maximum diameter. Scale bar, 25 μm. E, Quantification of cortical astrocyte maximum diameter in female and male animals. Median ± interquartile range (violin plots) represent individual cells. Dots represent individual mice (WT F, 5; Adrb1 cKO F, 6; WT M, 3; Adrb1 cKO M, 5). Data from 3-5 cells were averaged per mouse. Female statistics: two-tailed unpaired t test, run on per-cell data (t(43) = 2.877, **p = 0.00602); two-tailed unpaired t test, run on per-mouse data (t(9) = 3.587, **p = 0.00509). Male statistics: two-tailed unpaired t test, run on per-cell data (t(27) = 0.7651, ns, p = 0.4509); two-tailed unpaired t test, run on per-mouse data (t(6) = 0.8558, ns, p = 0.4249). F, Representative images of GFAP expression per cortical astrocyte. Images represent the masked lckGFP (red) and GFAP (cyan) signal from an Imaris surface reconstruction of a single cortical astrocyte. Scale bar, 25 μm. G, Quantification of per-cell GFAP expression in female and male animals. Median ± interquartile range (violin plots) represent individual cells. Dots represent individual mice (WT F, 5; Adrb1 cKO F, 6; WT M, 3; Adrb1 cKO M, 5). AU, Arbitrary units. Data from 3-5 cells were averaged per mouse. Female statistics: Mann–Whitney test, run on per-cell data (U(44) = 157, *p = 0.0221); Mann–Whitney test, run on per-mouse data (U(9) = 9, ns, p = 0.3290). Male statistics: Mann–Whitney test, run on per-cell data (U(27) = 100, ns, p = 0.9479); Mann–Whitney test, run on per-mouse data (U(6) = 7, ns, p > 0.9999). H, Representative images of corpus callosum astrocytes in control or Adrb1 cKO littermates. White line indicates border of cell. Scale bar, 25 μm. I, Quantification of corpus callosum astrocyte maximum diameter. Median ± interquartile range (violin plots) represent individual cells. Dots represent individual mice (WT, 4; Adrb1 cKO, 5). Data from 2-4 cells were averaged per mouse. Statistics: two-tailed unpaired t test, run on per-cell data (t(26) = 1.233, p = 0.2286); two-tailed unpaired t test, run on per-mouse data (t(7) = 1.233, ns, p = 0.2573).
