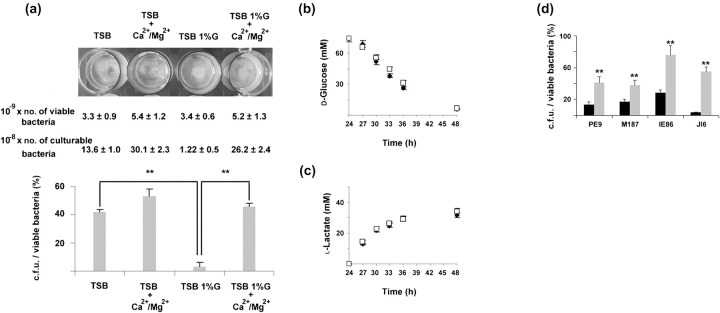
Fig. 2.
Effect of calcium and magnesium on the glucose-induced cell dormancy. (a) The number of c.f.u. over the number of viable bacteria obtained from biofilms grown as indicated shown as percentages. Results are a representative example of four independent experiments. Statistically significant differences between groups (P<0.01, ANOVA) are indicated by asterisks (**). Numbers of viable and culturable bacteria within each biofilm grown as described are also presented. (b, c) Determination of (b) glucose consumption and (c) lactic acid accumulation over time in cultures of biofilms grown in TSB 1 %G (□) or TSB 1 %G+Ca2+/Mg2+ (⧫). Results represent the mean value±sd and are a representative example of three independent experiments. (d) The number of c.f.u. over the number of viable bacteria obtained from S. epidermidis PE9, M187, JI6 and IE86 biofilms grown in TSB 1 %G (black bars) or TSB 1 %G+Ca2+/Mg2+ (grey bars) shown as percentages. Results are a representative example of two independent experiments. Statistically significant differences between groups (P<0.01, ANOVA) are indicated by asterisks (**).

