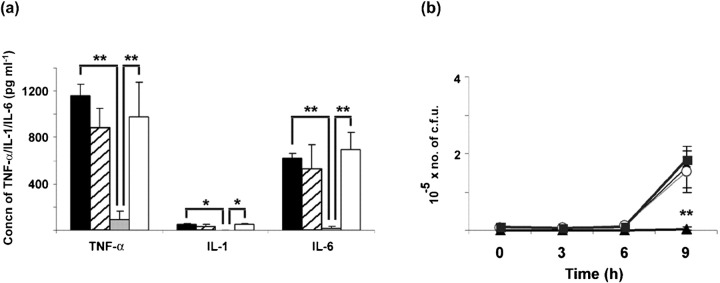
Fig. 3.
Effect of cell dormancy on BMDM activation. (a) Concentrations of TNF-α, IL-1 and IL-6 in cell culture supernatants of BMDMs after 9 h incubation with 1×10⁴ live bacteria obtained from S. epidermidis biofilms grown as indicated. Black bars, TSB; hatched bars, TSB+Ca2+/Mg2+; grey bars, TSB 1%G; white bars, TSB 1%G+Ca2+/Mg2+. (b) Numbers of c.f.u. in BMDM culture supernatants determined at 3 h intervals after bacterial challenge. Results are a representative example of three independent experiments. ⧫, TSB; ○, TSB+Ca2+/Mg2+; ▴, TSB 1%G; ▪, TSB 1%G+Ca2+/Mg2+. The statistically significant difference between the TSB 1 %G inoculum and the other inocula (P<0.01, ANOVA) is indicated by asterisks (**).

