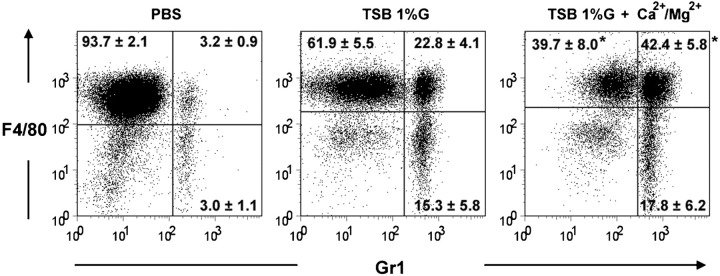
Fig. 5.
Effect of cell dormancy on peritoneal macrophage activation. Flow cytometric analysis of peritoneal cell exudates after intra-peritoneal challenge with 5×10⁵ S. epidermidis bacteria obtained from biofilms grown in TSB 1 %G or TSB 1 %G+Ca2+/Mg2+. Dot plots are representative examples of two independent experiments (n = 4 per group). The proportions±sd of non-activated macrophages (F4/80+Gr1−), activated macrophages (F4/80+Gr1+) or macrophages at a final stage of activation (F4/80−Gr1+) are shown within the dot plots. Cells with typical FSC and SSC parameters for lymphoid cells were excluded from the analysis. The statistically significant difference between the TSB 1 %G and TSB1 %G+Ca2+/Mg2+ groups (P<0.05, ANOVA) is indicated by an asterisk (*).

