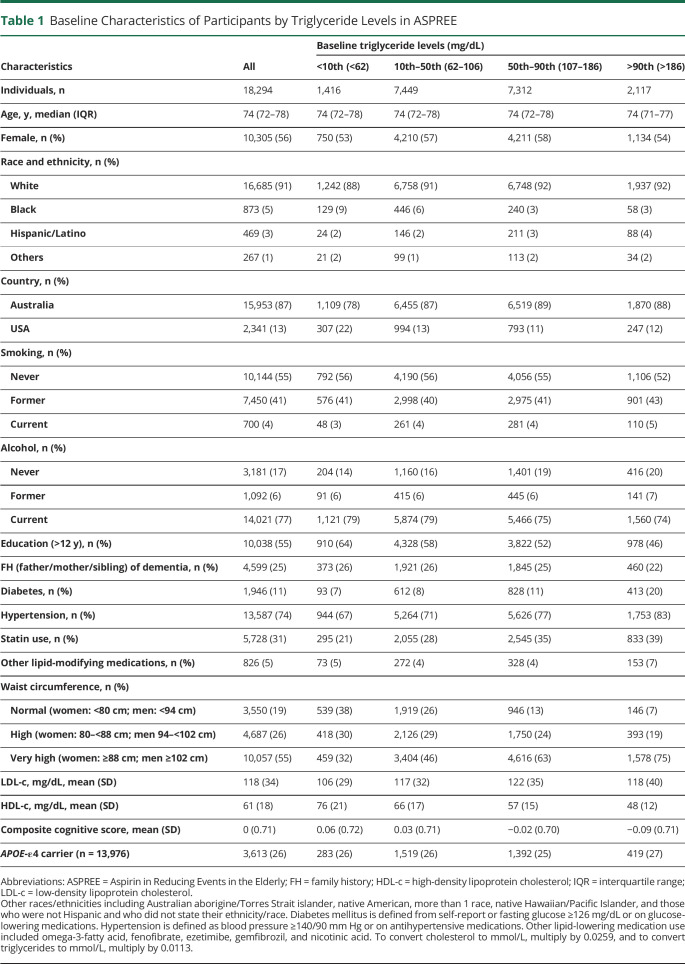
Table 1.
Baseline Characteristics of Participants by Triglyceride Levels in ASPREE
| Characteristics | All | Baseline triglyceride levels (mg/dL) | |||
| <10th (<62) | 10th–50th (62–106) | 50th–90th (107–186) | >90th (>186) | ||
| Individuals, n | 18,294 | 1,416 | 7,449 | 7,312 | 2,117 |
| Age, y, median (IQR) | 74 (72–78) | 74 (72–78) | 74 (72–78) | 74 (72–78) | 74 (71–77) |
| Female, n (%) | 10,305 (56) | 750 (53) | 4,210 (57) | 4,211 (58) | 1,134 (54) |
| Race and ethnicity, n (%) | |||||
| White | 16,685 (91) | 1,242 (88) | 6,758 (91) | 6,748 (92) | 1,937 (92) |
| Black | 873 (5) | 129 (9) | 446 (6) | 240 (3) | 58 (3) |
| Hispanic/Latino | 469 (3) | 24 (2) | 146 (2) | 211 (3) | 88 (4) |
| Others | 267 (1) | 21 (2) | 99 (1) | 113 (2) | 34 (2) |
| Country, n (%) | |||||
| Australia | 15,953 (87) | 1,109 (78) | 6,455 (87) | 6,519 (89) | 1,870 (88) |
| USA | 2,341 (13) | 307 (22) | 994 (13) | 793 (11) | 247 (12) |
| Smoking, n (%) | |||||
| Never | 10,144 (55) | 792 (56) | 4,190 (56) | 4,056 (55) | 1,106 (52) |
| Former | 7,450 (41) | 576 (41) | 2,998 (40) | 2,975 (41) | 901 (43) |
| Current | 700 (4) | 48 (3) | 261 (4) | 281 (4) | 110 (5) |
| Alcohol, n (%) | |||||
| Never | 3,181 (17) | 204 (14) | 1,160 (16) | 1,401 (19) | 416 (20) |
| Former | 1,092 (6) | 91 (6) | 415 (6) | 445 (6) | 141 (7) |
| Current | 14,021 (77) | 1,121 (79) | 5,874 (79) | 5,466 (75) | 1,560 (74) |
| Education (>12 y), n (%) | 10,038 (55) | 910 (64) | 4,328 (58) | 3,822 (52) | 978 (46) |
| FH (father/mother/sibling) of dementia, n (%) | 4,599 (25) | 373 (26) | 1,921 (26) | 1,845 (25) | 460 (22) |
| Diabetes, n (%) | 1,946 (11) | 93 (7) | 612 (8) | 828 (11) | 413 (20) |
| Hypertension, n (%) | 13,587 (74) | 944 (67) | 5,264 (71) | 5,626 (77) | 1,753 (83) |
| Statin use, n (%) | 5,728 (31) | 295 (21) | 2,055 (28) | 2,545 (35) | 833 (39) |
| Other lipid-modifying medications, n (%) | 826 (5) | 73 (5) | 272 (4) | 328 (4) | 153 (7) |
| Waist circumference, n (%) | |||||
| Normal (women: <80 cm; men: <94 cm) | 3,550 (19) | 539 (38) | 1,919 (26) | 946 (13) | 146 (7) |
| High (women: 80–<88 cm; men 94–<102 cm) | 4,687 (26) | 418 (30) | 2,126 (29) | 1,750 (24) | 393 (19) |
| Very high (women: ≥88 cm; men ≥102 cm) | 10,057 (55) | 459 (32) | 3,404 (46) | 4,616 (63) | 1,578 (75) |
| LDL-c, mg/dL, mean (SD) | 118 (34) | 106 (29) | 117 (32) | 122 (35) | 118 (40) |
| HDL-c, mg/dL, mean (SD) | 61 (18) | 76 (21) | 66 (17) | 57 (15) | 48 (12) |
| Composite cognitive score, mean (SD) | 0 (0.71) | 0.06 (0.72) | 0.03 (0.71) | −0.02 (0.70) | −0.09 (0.71) |
| APOE-ε4 carrier (n = 13,976) | 3,613 (26) | 283 (26) | 1,519 (26) | 1,392 (25) | 419 (27) |
Abbreviations: ASPREE = Aspirin in Reducing Events in the Elderly; FH = family history; HDL-c = high-density lipoprotein cholesterol; IQR = interquartile range; LDL-c = low-density lipoprotein cholesterol.
Other races/ethnicities including Australian aborigine/Torres Strait islander, native American, more than 1 race, native Hawaiian/Pacific Islander, and those who were not Hispanic and who did not state their ethnicity/race. Diabetes mellitus is defined from self-report or fasting glucose ≥126 mg/dL or on glucose-lowering medications. Hypertension is defined as blood pressure ≥140/90 mm Hg or on antihypertensive medications. Other lipid-lowering medication use included omega-3-fatty acid, fenofibrate, ezetimibe, gemfibrozil, and nicotinic acid. To convert cholesterol to mmol/L, multiply by 0.0259, and to convert triglycerides to mmol/L, multiply by 0.0113.

