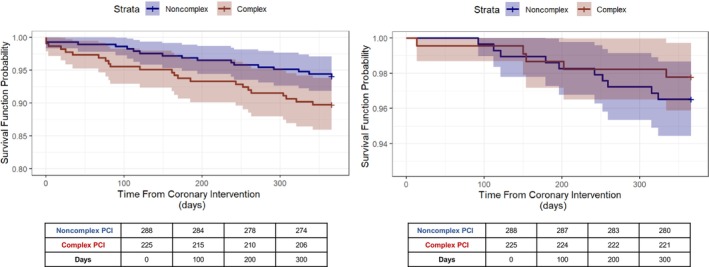
Figure 2. Kaplan–Meier curves for secondary outcomes.

Figure displays the Kaplan–Meier survival curves (survival function probability vs time from coronary intervention in days) for all‐cause death (left) and target lesion revascularization (right) at 12 months from index percutaneous coronary intervention (PCI). At‐risk tables are shown below each respective graph. The blue curves represent the group receiving noncomplex PCI, and the red curves represent the group receiving complex PCI.
