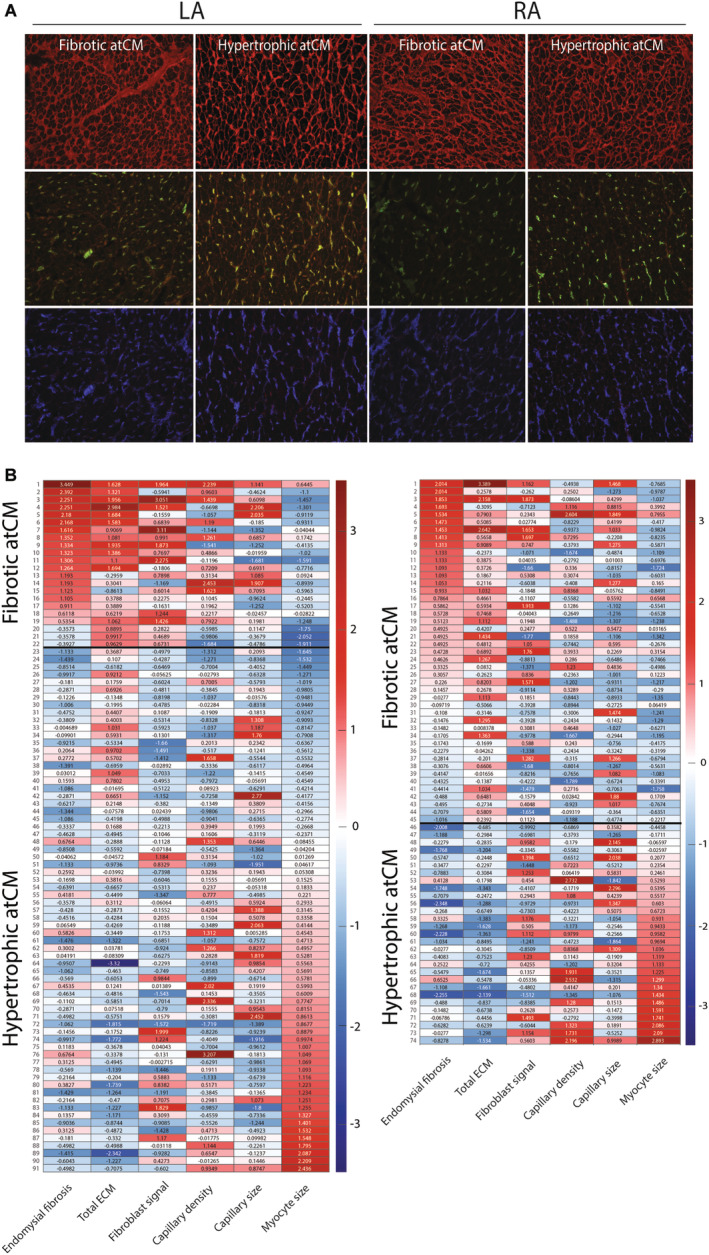
Figure 6. Clustering of LA and RA samples based on structural features.

A, Histological images of tissue features following staining with wheat germ agglutinin (WGA, red), CD31 (green), and vimentin (blue). B, Fuzzy k‐means clustering was applied to cluster LA and RA samples on structural features. One cluster shows predominantly more fibrotic features, whereas the other cluster contains mainly samples with more pronounced cardiomyocyte hypertrophy. The clusters where therefore named fibrotic atrial cardiomyopathy (atCM) and hypertrophic atrial cardiomyopathy, respectively. ECM indicates extracellular matrix content; LA, left atrial; and RA, right atrial.
