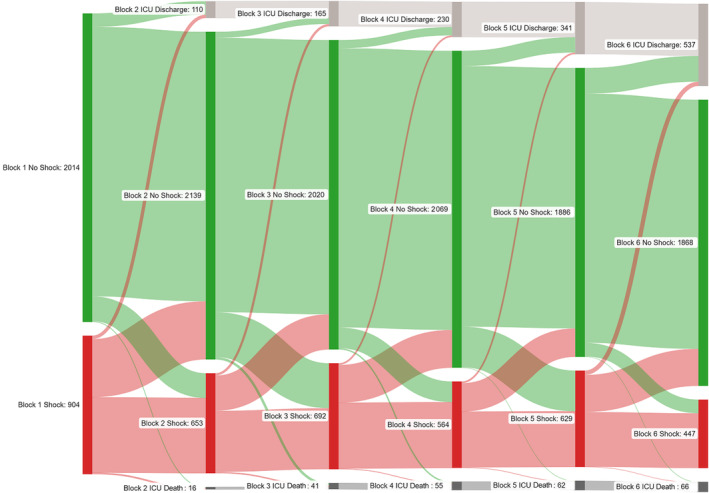
Figure 1. Sankey diagram demonstrating the evolution of shock (defined using the SCAI shock classification) during each 4‐hour CICU block.

Patients who left the CICU during a prior block were classified as CICU discharge or CICU deaths during subsequent blocks. Figure generated using SankeyMATIC (www.sankeymatic.com). CICU indicates cardiac intensive care unit; ICU, intensive care unit; and SCAI, Society for Cardiovascular Angiography and Interventions.
