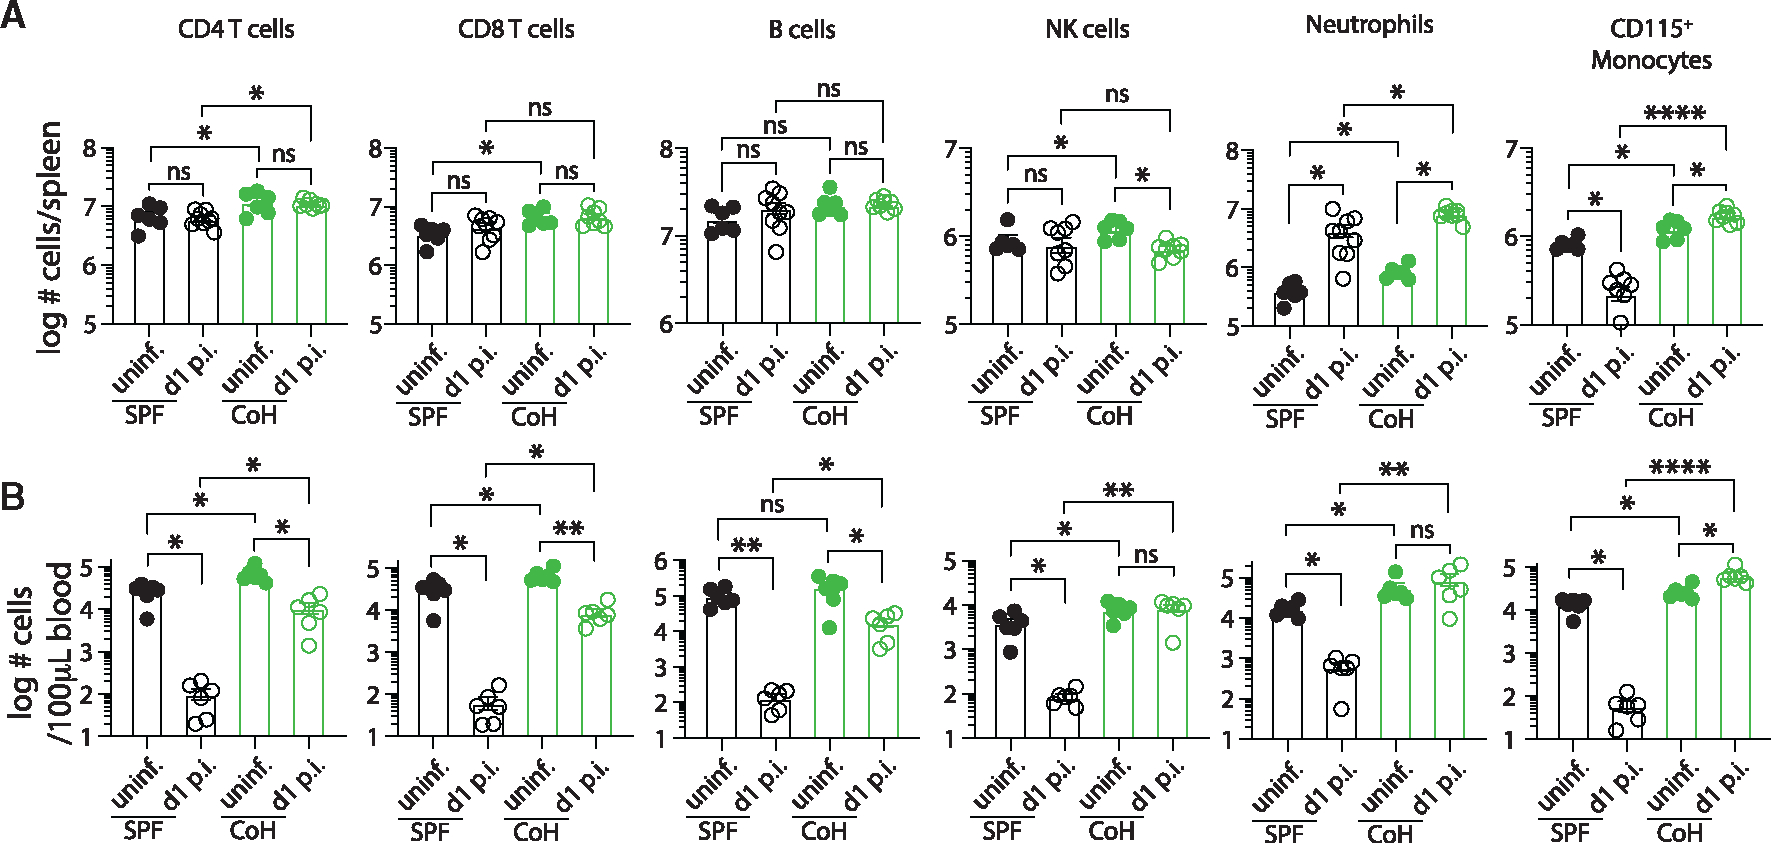
Figure 3. CoH mice exhibit increased numbers of CD115+ monocytes following systemic UPEC infection.

Number of CD4 T cells, CD8 T cells, B cells, NK cells, neutrophils, and CD115+ monocytes in the (A) spleen and (B) blood of SPF and CoH mice before and 24 h after systemic UPEC infection. *p ≤ 0.05, **p ≤ 0.01, ***p ≤ 0.005, and ****p < 0.0001 as determined by Kruskal-Wallis test, with a Dunn’s post hoc test to correct for multiple comparisons. Data in (A) and (B) were combined from two experiments using a total of 6–9 mice per group, where each symbol represents a mouse and bars indicate means with SEM.
