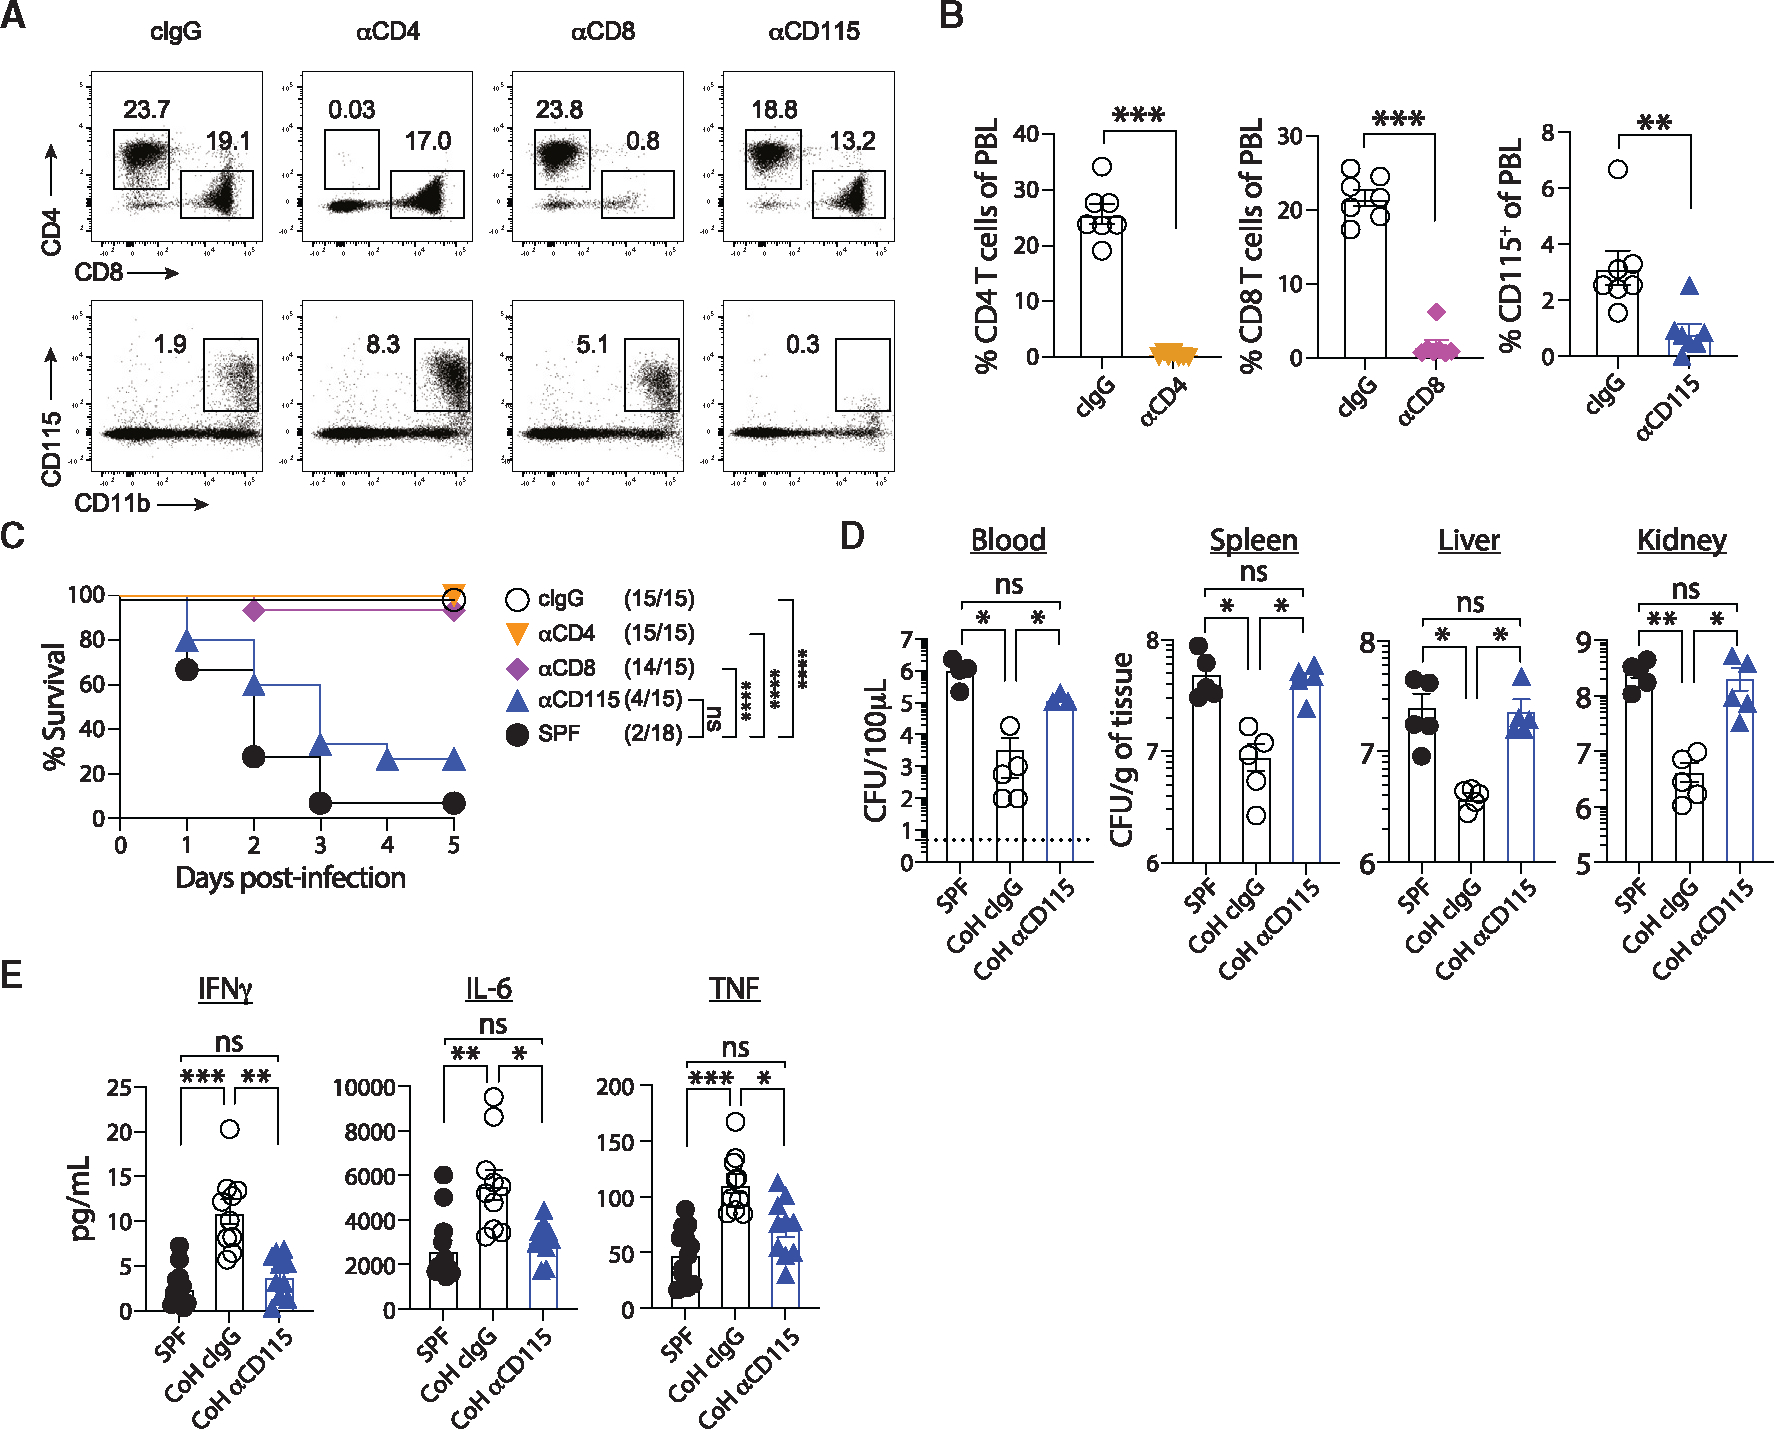
Figure 4. CD115+ cells mediate protection in CoH mice against systemic UPEC infection.

(A–C) CoH mice were injected with control IgG or mAb to deplete CD4 T cells, CD8 T cells, or CD115+ monocytes. (A) Representative dot plots showing detection of CD4 and CD8 T cells (top) and CD115+ monocytes (bottom) in CoH mice after injection with control IgG or anti-CD4, -CD8, or -CD115 depleting mAbs. (B) Percentage of CD4 T cells, CD8 T cells, or CD115+ monocytes among peripheral blood lymphocytes in CoH mice injected with control IgG or anti-CD4, -CD8, or -CD115 depleting mAbs. (C) Survival of SPF mice, CoH mice injected with anti-CD115, anti-CD8, anti-CD4, or control IgG at the indicated days post-infection.
(D) Bacterial CFU per 100 μL of blood or grams of spleen, liver, and kidney 24 h following UPEC infection from SPF mice, CoH mice injected with control IgG, or CoH mice injected with anti-CD115 mAbs.
(E) Serum IFN-γ, IL-6, and TNF-α concentrations from SPF mice, CoH mice injected with control IgG, or CoH mice injected with anti-CD115 mAb 3 h following UPEC infection. ns, not significant, *p ≤ 0.05, **p ≤ 0.01, ***p ≤ 0.001, and ***p ≤ 0.0001, as determined by nonparametric Mann-Whitney test (B), log rank test (C), or Kruskal-Wallis test, with a Dunn’s post hoc test to correct for multiple comparisons (D and E). Data in (A) and (B) are representative from three experiments using 7–8 mice per group, or 4–5 mice per group in (D). Combined data from three experiments using a total of 15–18 mice per group are in (C), and two experiments using a total of 10–12 mice per group are in (E). Each symbol in (B, D, and E) represents a mouse and bars indicate means with SEM. Dashed line in (D) indicates limit of detection of the assay.
