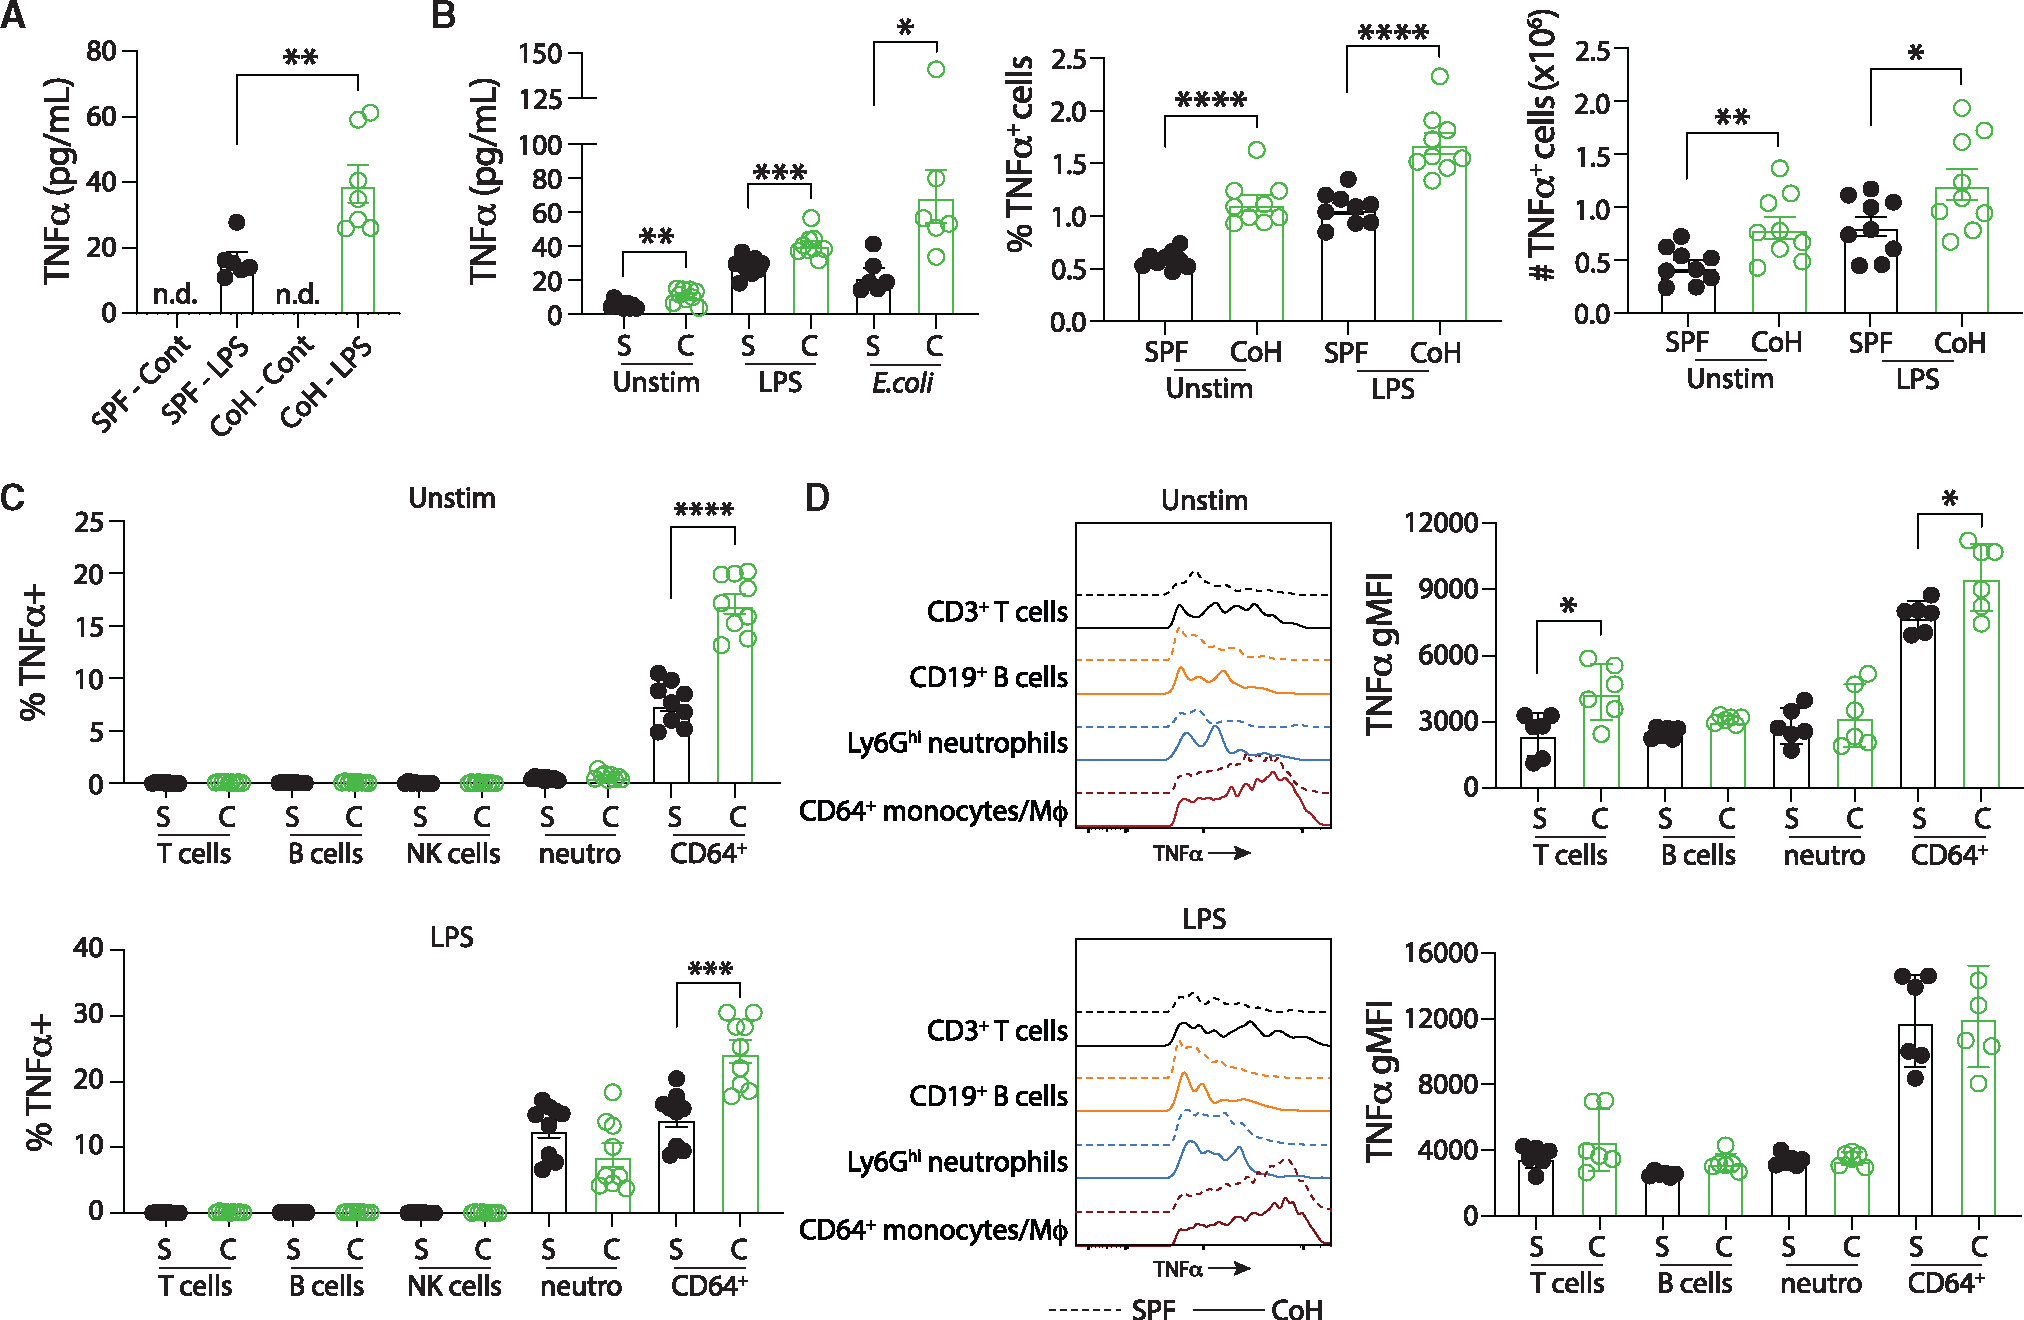
Figure 5. CoH monocyte/Mφ produce more TNF-α than SPF monocyte/Mφ during in vitro culture.

(A) Steady-state innate immune function was measured ex vivo by adding heparinized whole blood to tubes containing RPMI alone (“control” tubes) or RPMI and 0.5 ng/mL LPS and incubated for 4 h at 37°C. The amount of TNF-α in the supernatant was determined by ELISA.
(B) SPF and CoH splenocytes (2 × 10⁶ cells) were incubated alone or with either LPS (100 ng/mL) or UPEC (5:1 UPEC:splenocytes) for 4 h. The amount of TNF-α in the supernatant was then measured by ELISA (left) and the frequency (middle) and number (right) of TNF-α+ cells was determined by flow cytometry.
(C) The frequency of TNF-α+ cells within T cells, B cells, NK cells, neutrophils, and CD64+ monocytes/M4 from the unstimulated and LPS-stimulated splenocyte cultures were also determined by flow cytometry.
(D) Geometric mean fluorescence intensity (gMFI) of TNF-α expression by unstimulated and LPS-stimulated TNF-α+ T cells, B cells, NK cells, neutrophils, and CD64+ monocytes/Mφ was determined by flow cytometry. Representative plots and cumulative data are shown and data in (A–D) were combined from at least two independent experiments using a total of 6–9 mice per group, where each symbol represents a mouse and bars indicate means with SEM. *p ≤ 0.05, **p ≤ 0.01, ***p ≤ 0.005, and ****p < 0.0001 as determined by nonparametric Mann-Whitney test.
