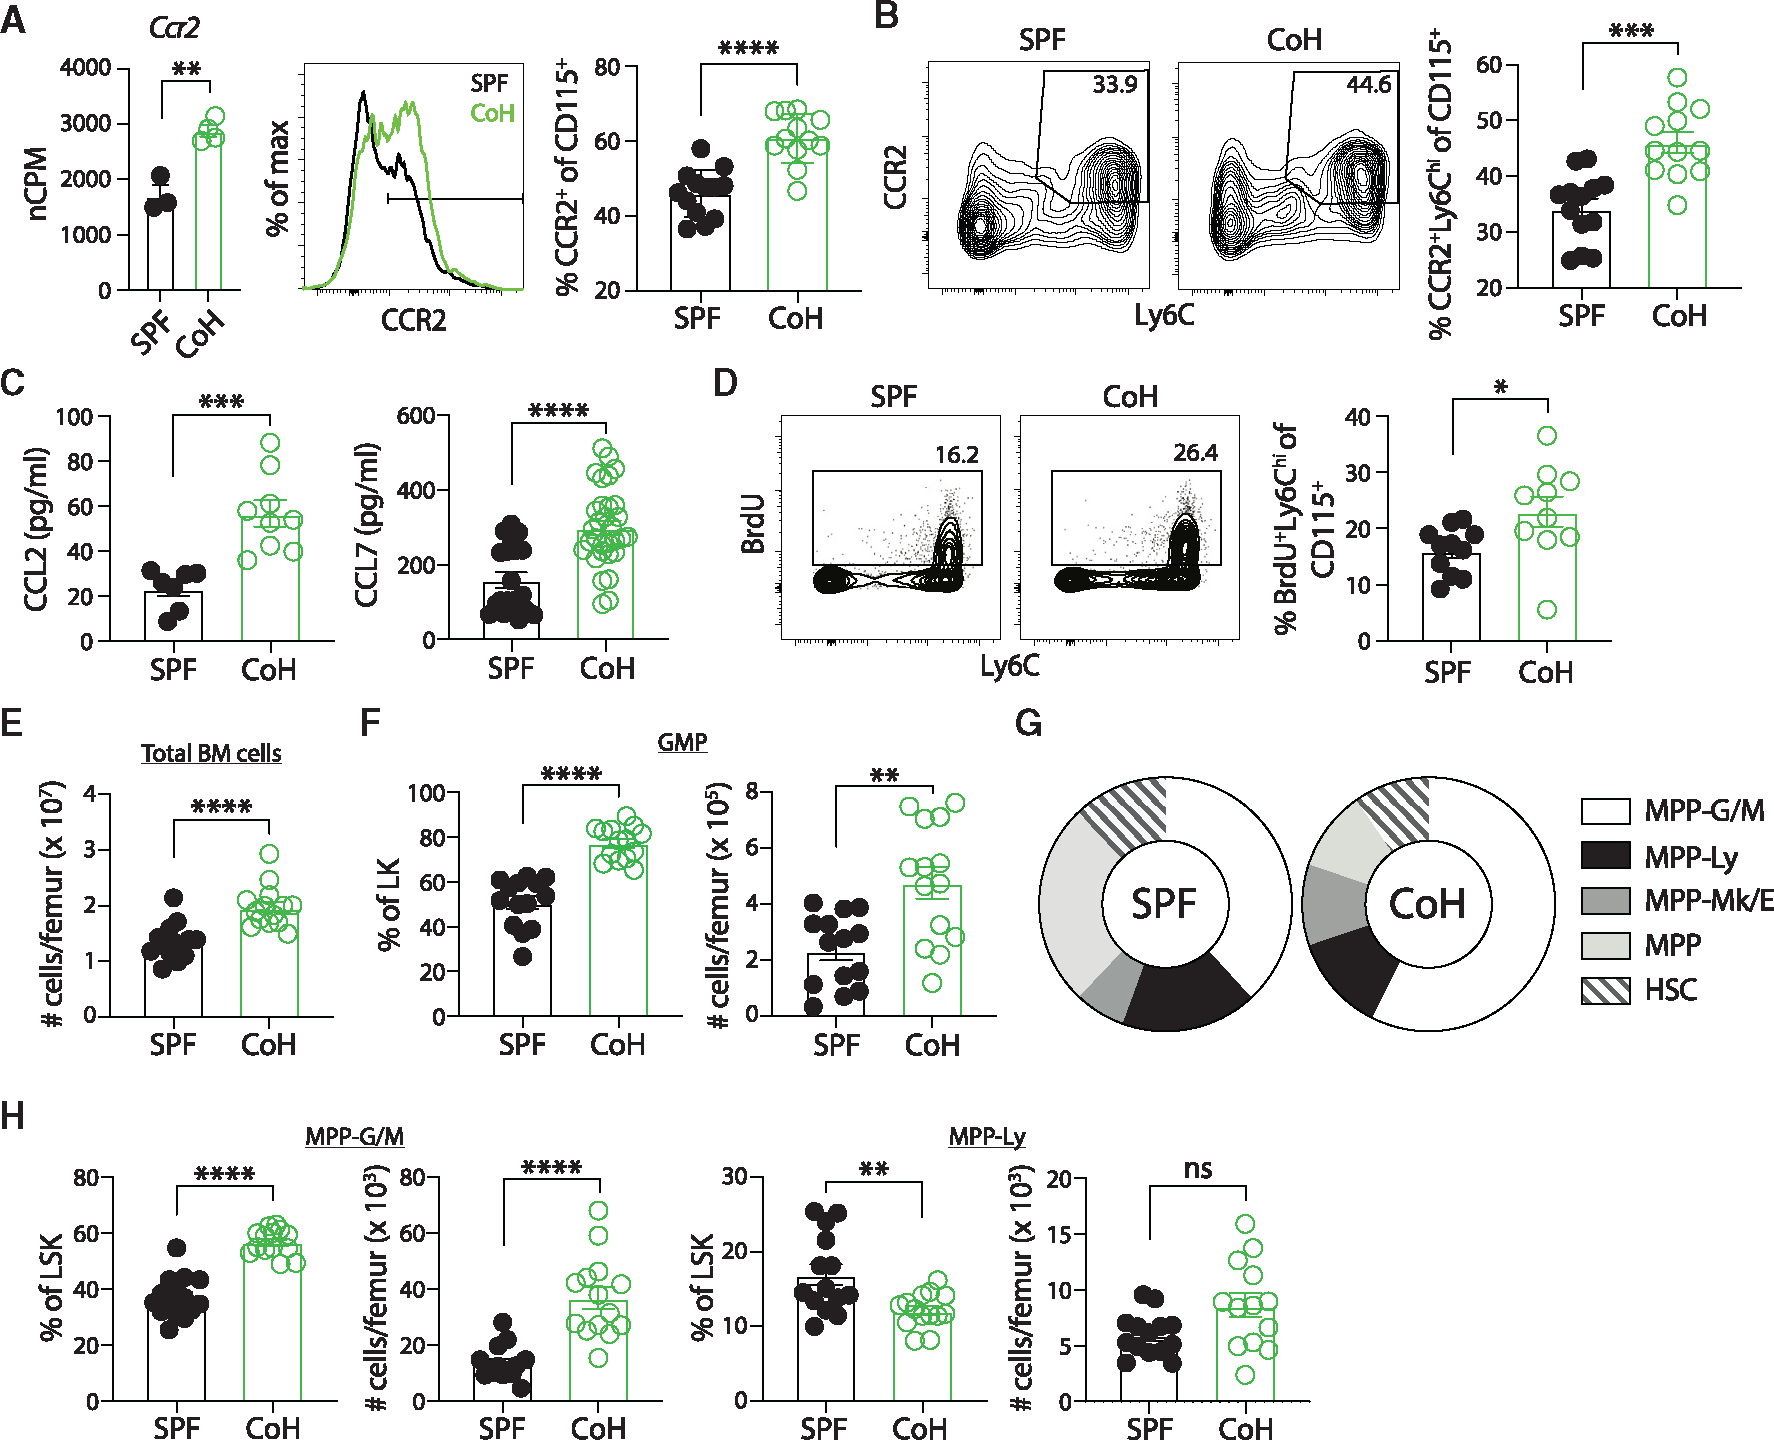
Figure 7. Increased egress of “classical” Ly6Chi CD115+ monocytes from bone marrow and enhanced myelopoiesis in steady-state CoH mice.

(A) Number of Ccr2 mRNA transcripts in CD115+ monocytes from steady-state SPF and CoH mice (left), representative histogram of CCR2 protein expression on SPF and CoH CD115+ monocytes (middle), and frequency of CCR2+ cells among CD115+ monocytes in the spleens of SPF and CoH mice as measured by flow cytometry (right).
(B) Representative flow cytometry plots showing expression of CCR2 and Ly6C double-positive cells from CD11b+CD115+ splenocytes (left) and frequency of CCR2+Ly6Chi CD115+ monocytes (right).
(C) Concentration of CCL2 and CCL7 in serum of mice 60 days after cohousing using Luminex.
(D) SPF and CoH mice were injected with 1 mg BrdU i.p. Blood was collected 16 h later, and peripheral blood leukocytes were stained to detect BrdU+ Ly6ChiCD115+ monocytes by flow cytometry.
(E–H) Bone marrow was isolated from steady-state SPF and CoH mice and progenitor populations were analyzed (see Figure S6A for gating strategy). (E) Total number of bone marrow cells per femur of SPF and CoH mice. (F) Absolute number per femur and percentage of granulocyte/monocyte progenitors (GMP) (lineage−Sca1−cKit+CD16+) within the lineage−cKit+ (LK) progenitor population.
(G) Percentage of multipotent progenitor (MMP) populations within the lineage−Sca1+cKit+ (LSK) population. MPP-granulocyte/monocyte (G/M) (Flt3−CD48+CD150−), MPP-lymphocyte (Ly) (Flt3+), MPP-megakaryocyte/erythrocyte (Mk/E) (Flt3−CD48+CD150+), MPP (Flt3−CD48−CD150−), and hematopoietic stem cell (HSC) (Flt3−CD48−CD150+).
(H) Absolute number per femur and percentage of MPP-G/M (left) and MPP-Ly (right) within the LSK population. *p ≤ 0.05, **p ≤ 0.01, ***p ≤ 0.005, and ****p < 0.0001 as determined by nonparametric Mann-Whitney test. Transcript (normalized copies per million [nCPM]) data in (A) were obtained from 3 to 4 mice per group. Flow data in (A) and (B) were combined from three experiments using a total of 12–13 mice per group, (C) were combined from at least two experiments with a total of 7–31 mice per group, (D) were combined from three experiments using a total of 10–11 mice per group, (E–H) were combined from three independent experiments using a total of 14 mice per group. Each symbol represents a mouse and bars indicate means with SEM.
