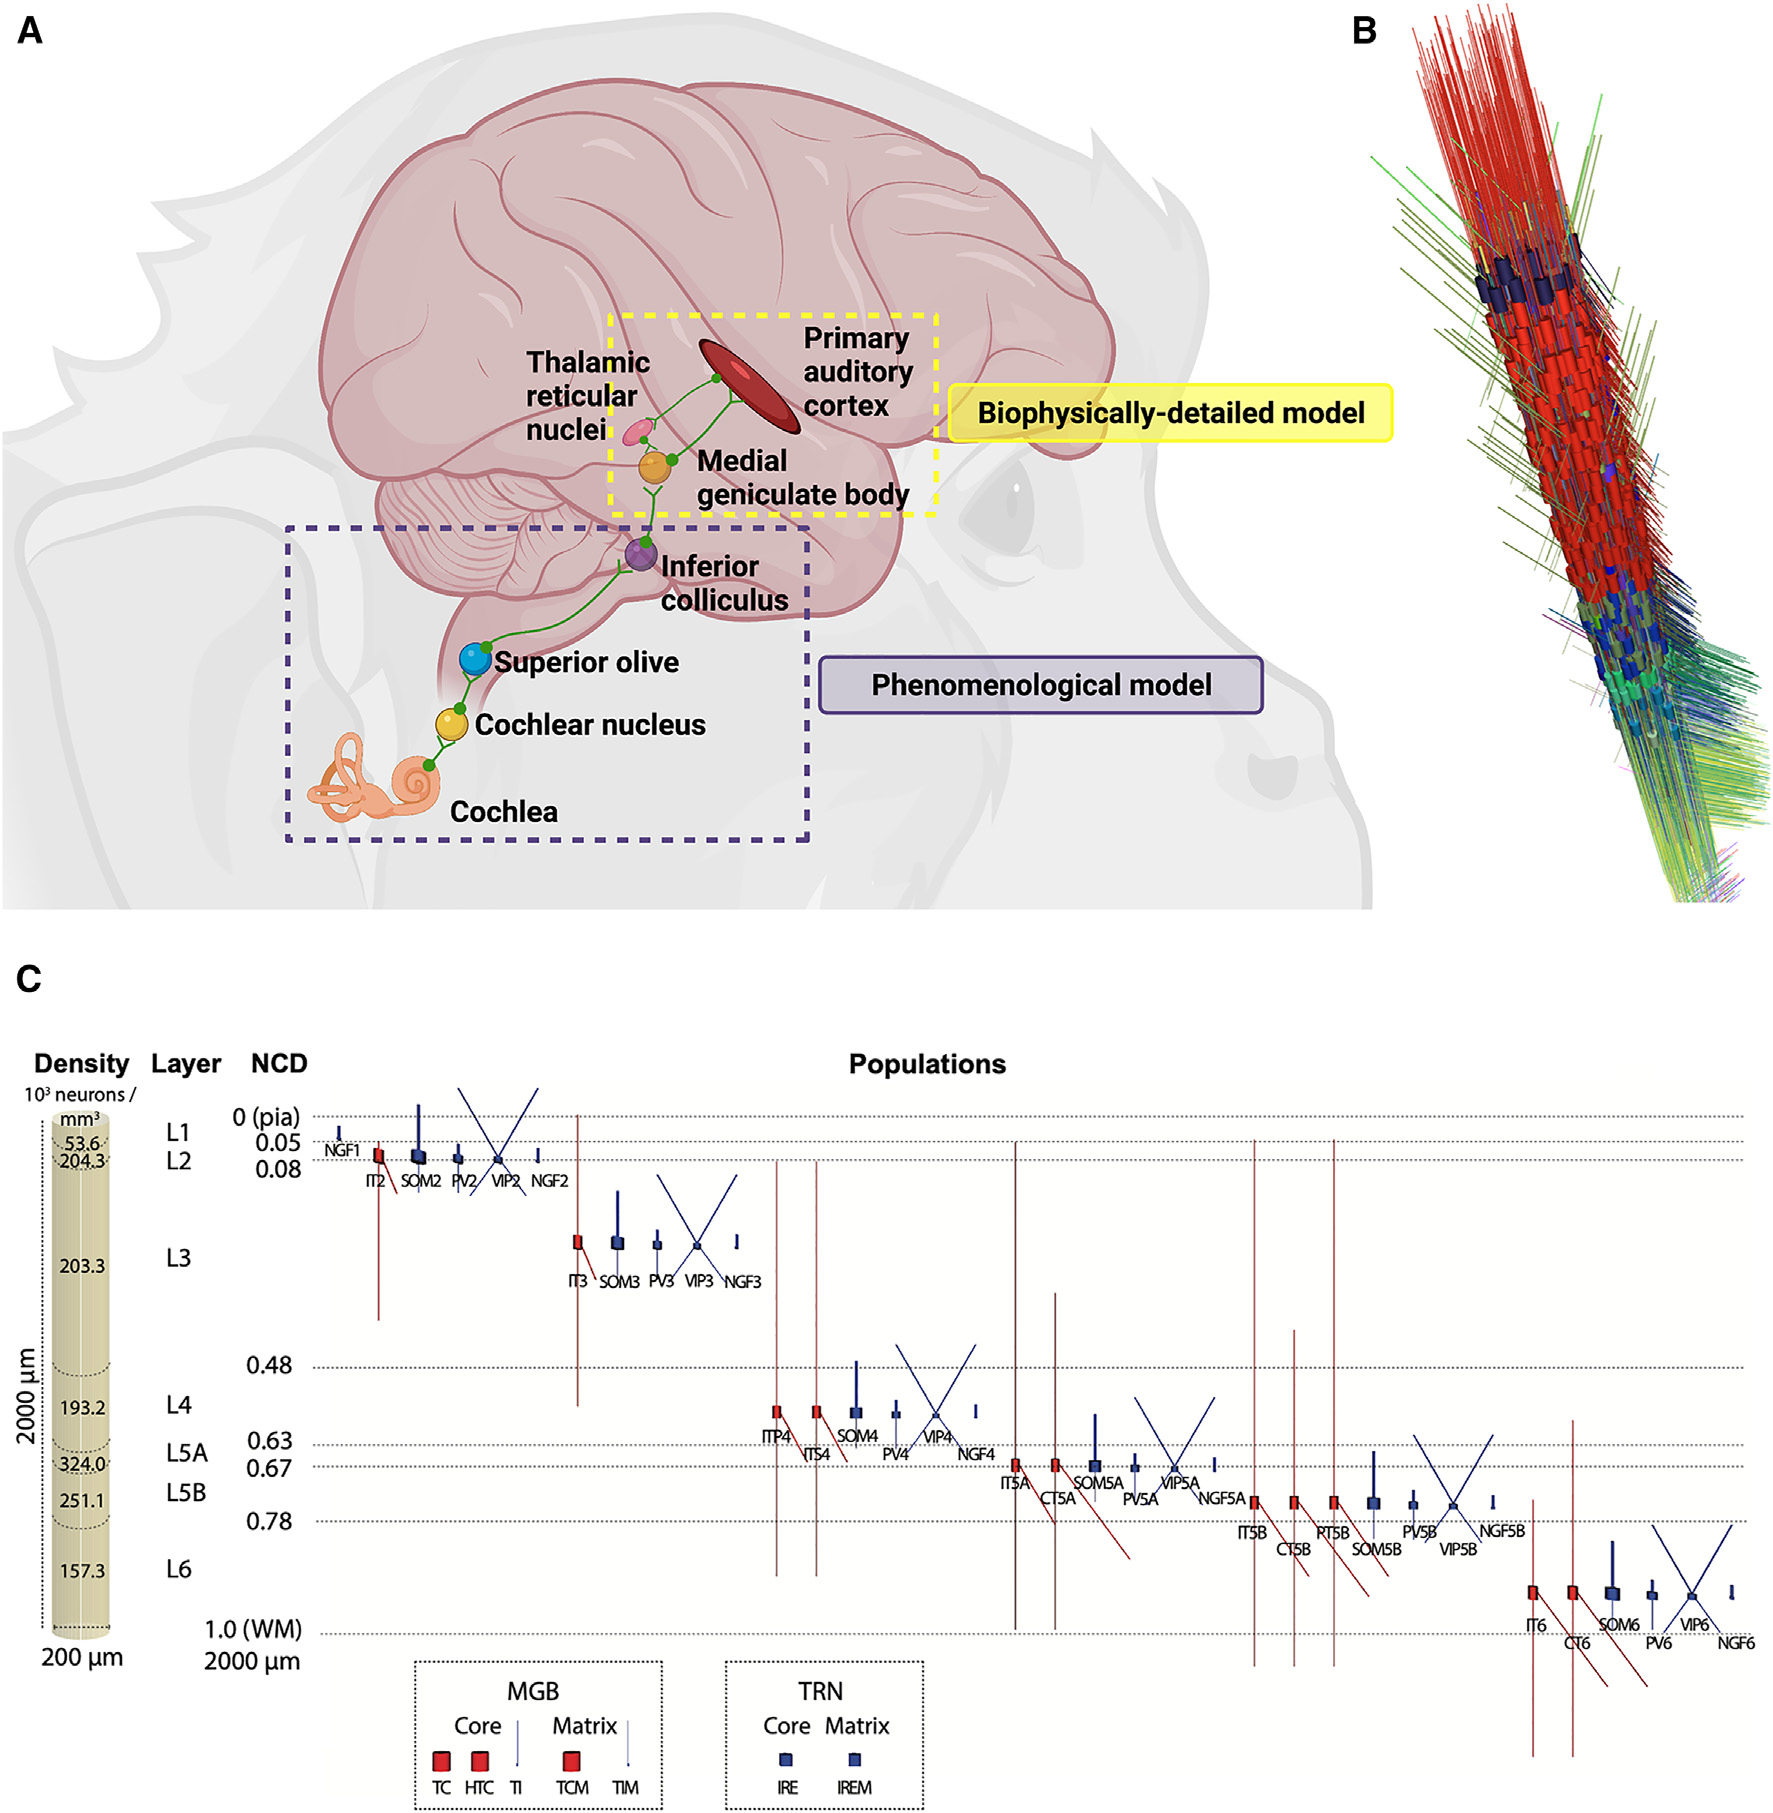
Figure 1. Overview of the macaque auditory system model and the biophysically detailed auditory thalamocortical circuits model.

(A) A phenomenological model is used to capture the transformation of input sound into electrical impulses in the cochlea, superior olive, and inferior colliculus (IC). Output from IC then drives a detailed biophysical model of auditory thalamocortical circuits, including medial geniculate body (MGB), thalamic reticular nuclei (TRN), and primary auditory cortex (A1). Note that many of the connections are bidirectional but are not shown for simplicity.
(B) 3D representation of the A1 column model (only 20% of neurons are shown for clarity).
(C) Dimensions of simulated A1 column with laminar cell densities, layer boundaries, cell morphologies, and distribution of populations. Medial geniculate body (MGB) and thalamic reticular nuclei (TRN) populations’ simplified morphologies are shown on the bottom, highlighting distinct core- and matrix-projecting populations. All models are conductance based with multiple ionic channels tuned to reproduce the cell’s electrophysiology. NCD denotes normalized cortical depth with values ranging from 0 (pia) to 1 (white matter [WM]).
