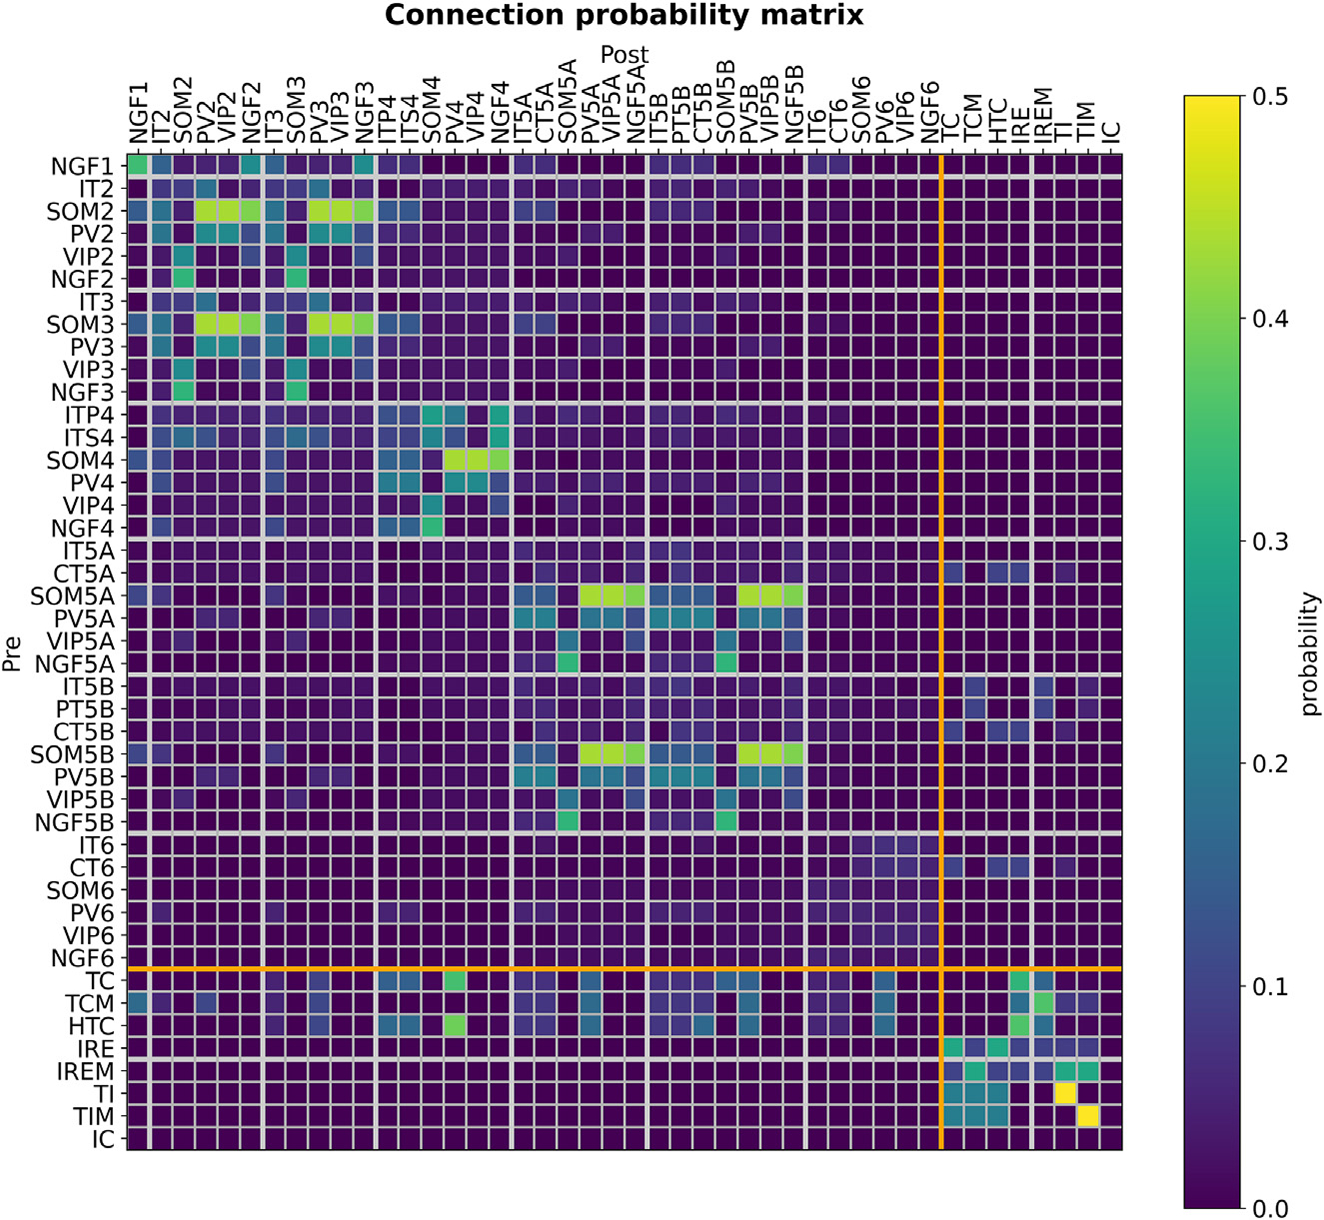
Figure 2. Connectivity matrix of model thalamocortical populations.

Probability of connection between all 36 cortical and 6 thalamic populations. Horizontal and vertical thick white lines separate cortical layers, and thick orange lines separate cortex from thalamus. Note that the IC→MGB connection is not shown as there is no feedback connection from MGB→IC in our model, given that we use phenomenological cochlea/IC models (see STAR Methods).
