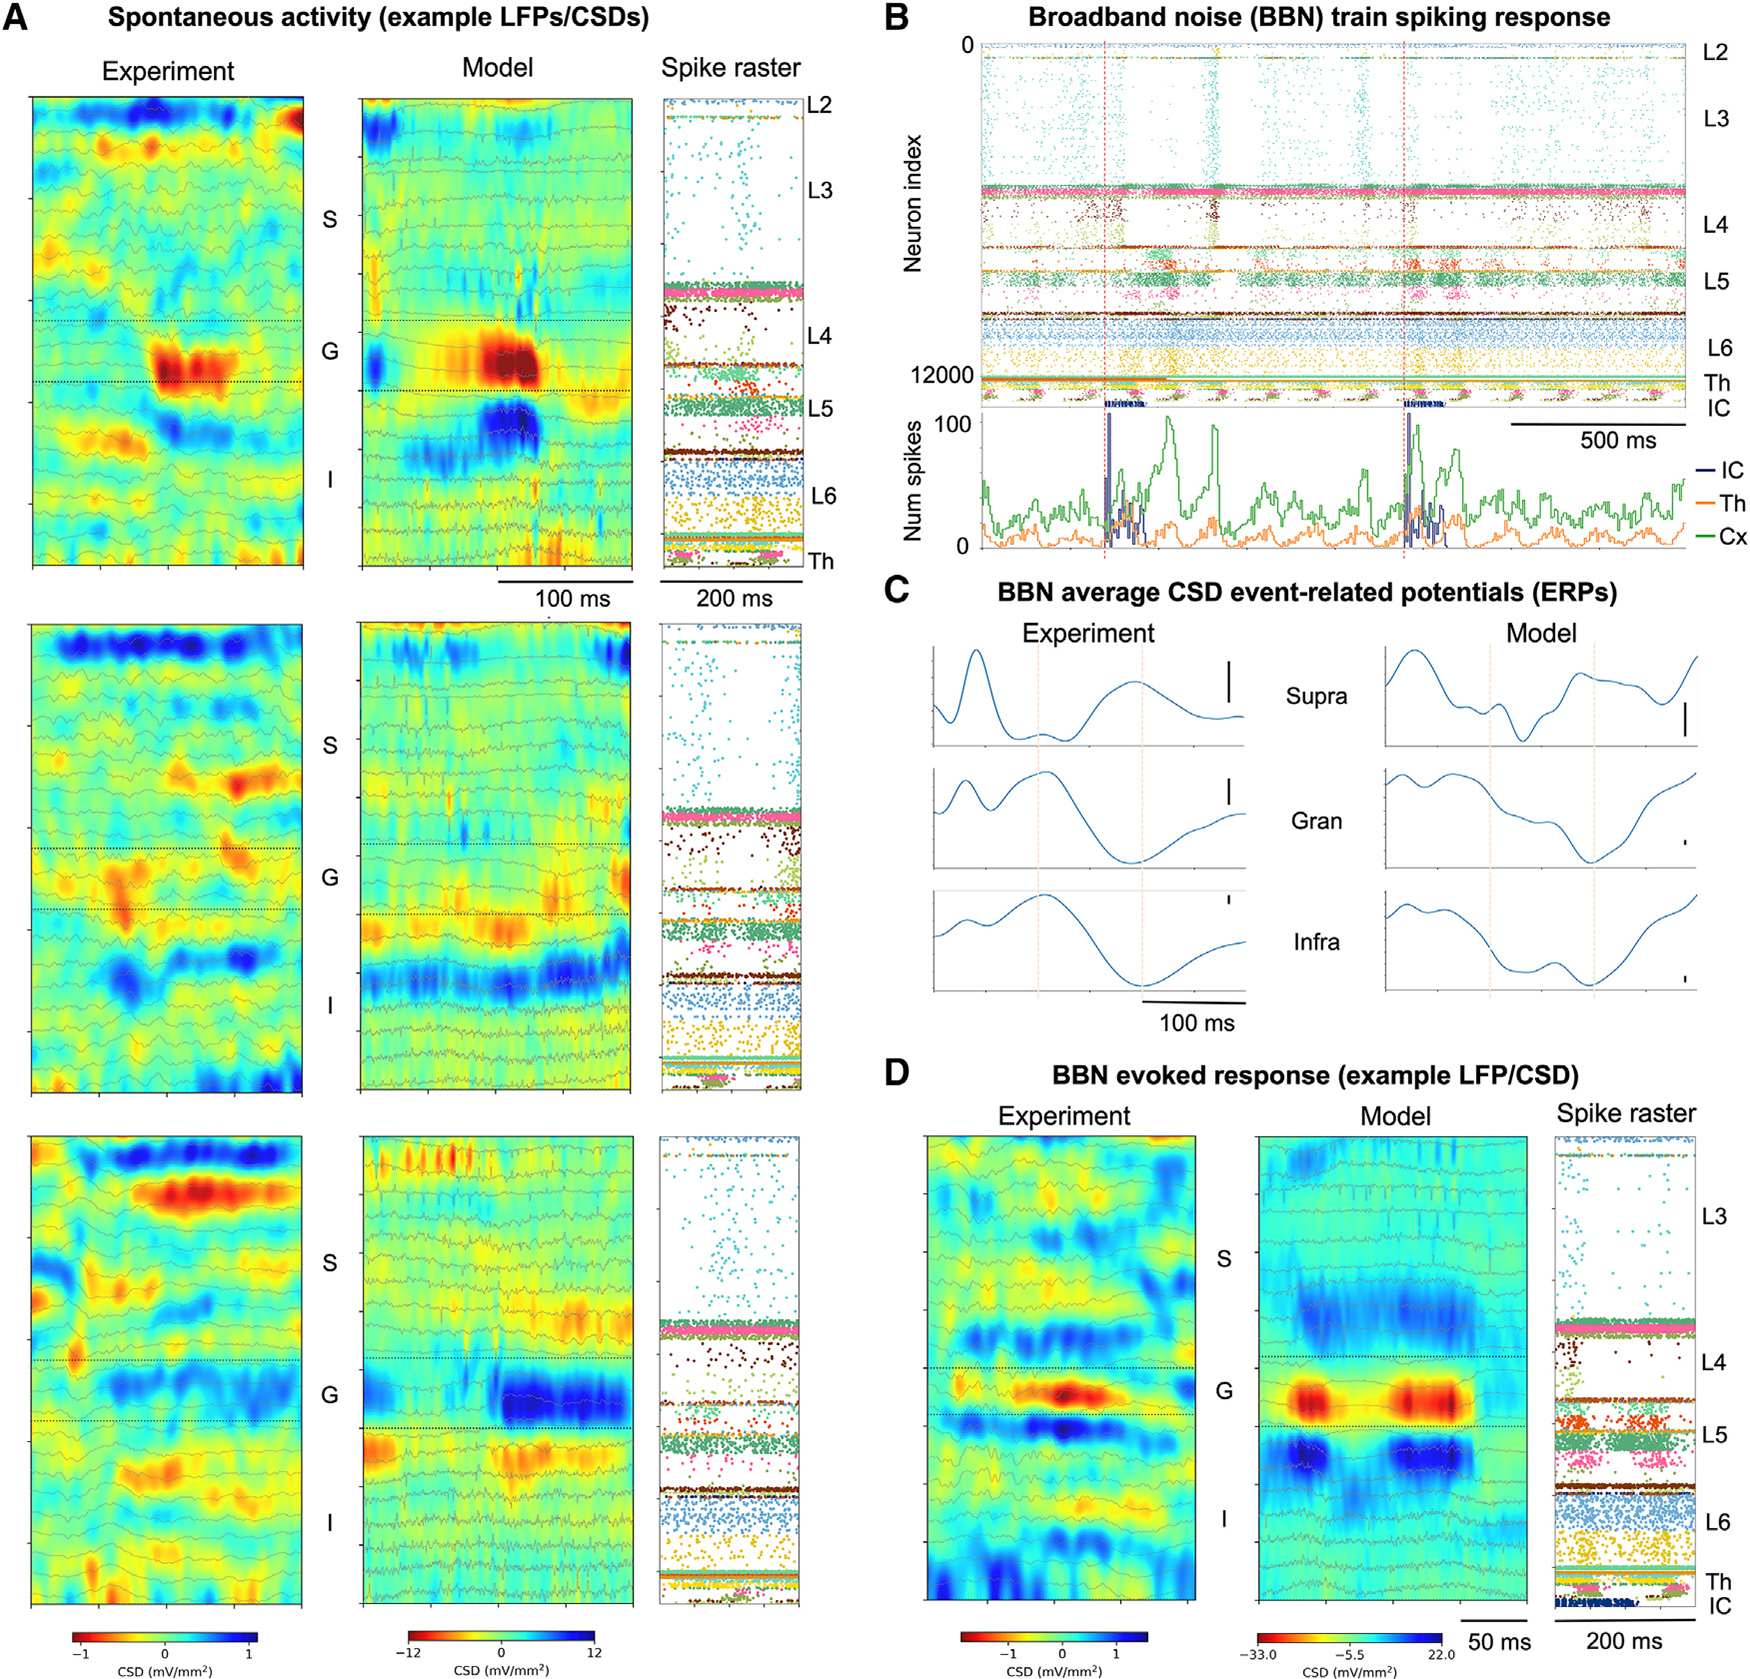
Figure 4. Example spiking and laminar LFP/CSD responses during spontaneous activity and broadband noise train stimuli and comparison to macaque in vivo LFP/CSD.

(A) Comparison of example spontaneous LFP/CSD in model and macaque, illustrating the variability of spontaneous activity patterns and how the model reproduced some key features of each example pattern (e.g., in top-left example, a 50-ms-long current sink in the granular layer and current source in the infragranular layer). Transmembrane currents (sinks and sources) in CSD color maps are color coded red and blue, respectively. y axis represents LFP and related CSD channels at depths spanning pia to white matter, with supragranular (S), granular (G), and infragranular (I) layers indicated.
(B) Spiking raster plot and spike time histogram of the model’s response to a broadband noise (BBN) stimulus train (red dotted line indicates BBN stimuli onset). (C) Comparison of macaque vs. model average CSD event-related potentials (ERPs) in response to BBN stimulus recorded at supragranular, granular, and infragranular layers (experiment, N = 122; model, N = 11; experiment scale bars represent 0.5 mV/mm2; model scale bars represent 1 mV/mm2; vertical dotted lines at 100 ms and 200 ms).
(D) Comparison of macaque and model example LFP/CSD response to BBN stimulus shows similar activation pattern (same color code and axes as in A).
