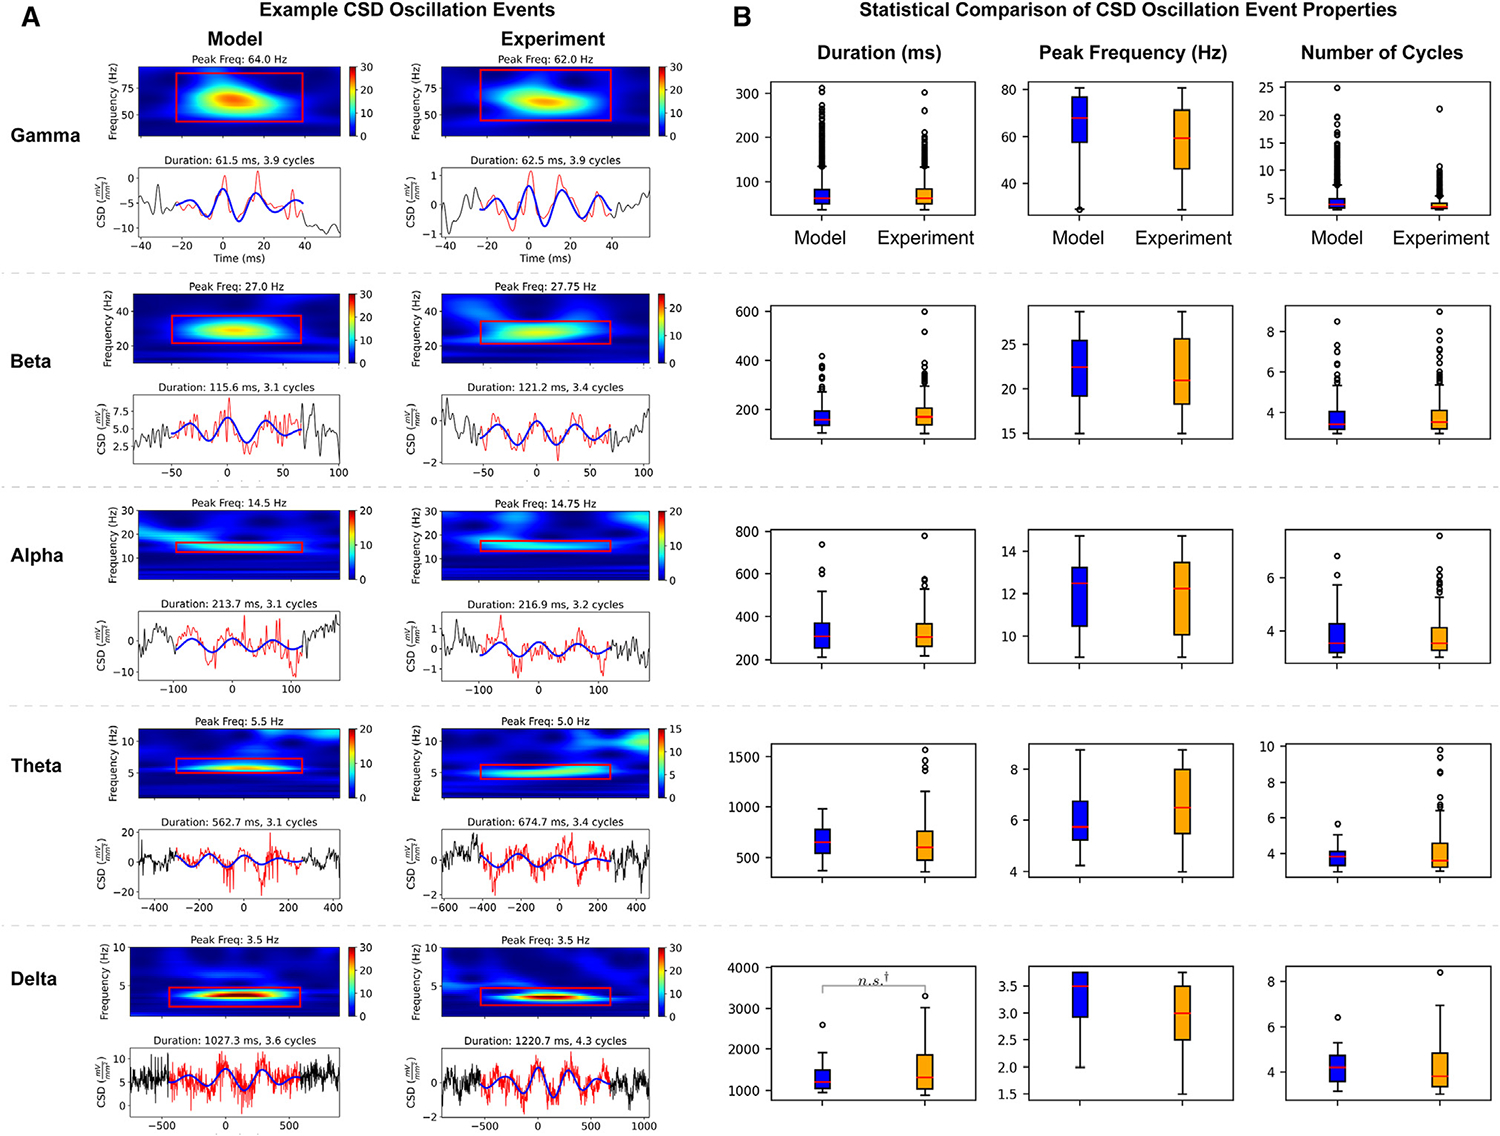
Figure 6. Comparison of spontaneous CSD oscillation events across frequency bands in the model and macaque experiments.

(A) Examples of similar oscillation events detected across frequency bands in model (left) and macaque experiments (right). Each event is depicted with a CSD spectrogram (top panels; power units are mV2/mm4/Hz; red bounding box delineates the oscillation event) and the CSD time series signal (bottom panels; red: raw CSD time series, blue: bandpass-filtered CSD time series using cutoff frequencies shown in spectrogram red bounding box). Theta and alpha events are from supragranular layers, beta and delta from infragranular layers, and gamma from the granular layer.
(B) Statistical comparison of spontaneous CSD oscillation event properties in the model and macaque experiments. Oscillation events were detected in resting-state recordings, then sorted by frequency band: delta (Nmodel = 12; Nexp = 55), theta (Nmodel = 44; Nexp = 126), alpha (Nmodel = 59; Nexp = 138), beta (Nmodel = 192; Nexp = 318), and gamma (Nmodel = 2,359; Nexp = 1,625). The following oscillation event features were compared for each frequency band: duration (ms), peak frequency (Hz), and number of cycles. Box-and-whisker plots (box = interquartile range [IQR]; whisker = 1.5·IQR; orange line = median; black circles = outliers) compare the model and experimental data distributions for each feature and frequency band. Statistical analysis revealed no statistically significant differences between the model and experiment means (t test, p > 0.05, not significant, denoted by n.s.y; applies to all panels but only shown once for clarity).
