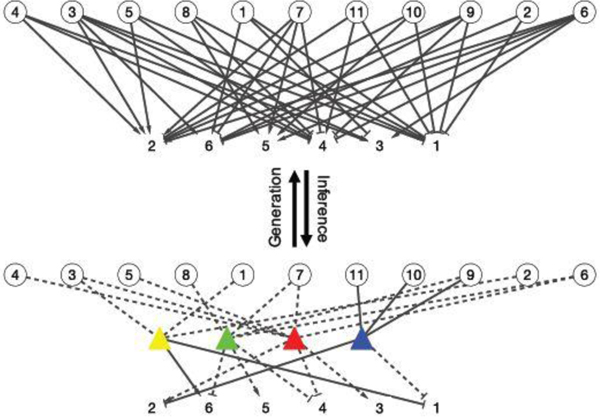
Fig. 4.
Edge-labeled random networks as an alternative representation of the DFA in Figure 2. The observed bipartite graph (top) is assumed to be generated by the latent tripartite graph (bottom). DFA addresses the inverse problem. Circles are patients, squares are symptoms and triangles are diseases whose colors have the same interpretations as in Figure 2. Dashed lines are latent whereas solid lines are known/observed. An undirected edge connecting patients and diseases is binary. Edges with arrow head or flat bars represent different types of SD relationships.

