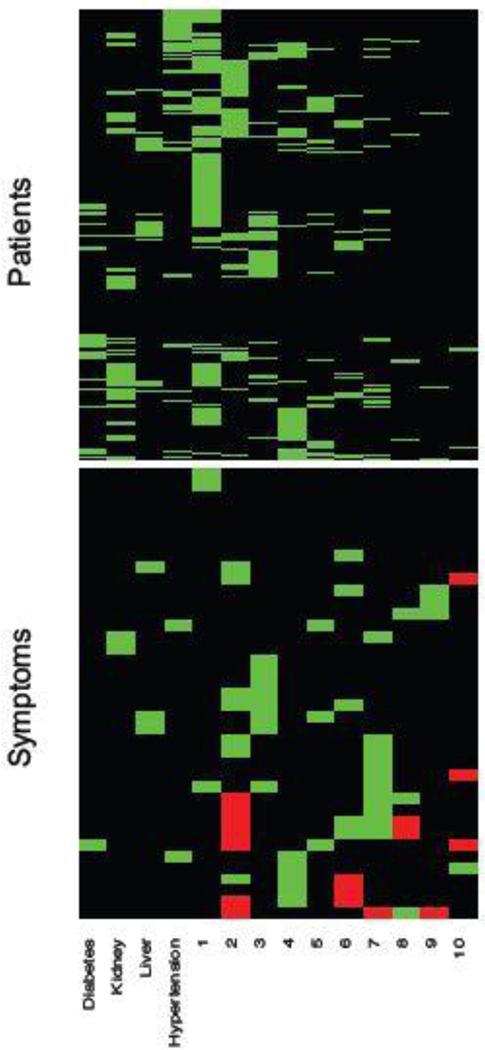
Fig. 7.
EHR data. The heatmap on top shows the estimated patient-disease relationships . The bottom part of the double heatmap shows the estimated symptom-disease relationships , with green, black and red cells representing 1, 0 and −1, respectively. The columns correspond to diseases and the rows are patients (top portion) and symptoms (bottom portion).

