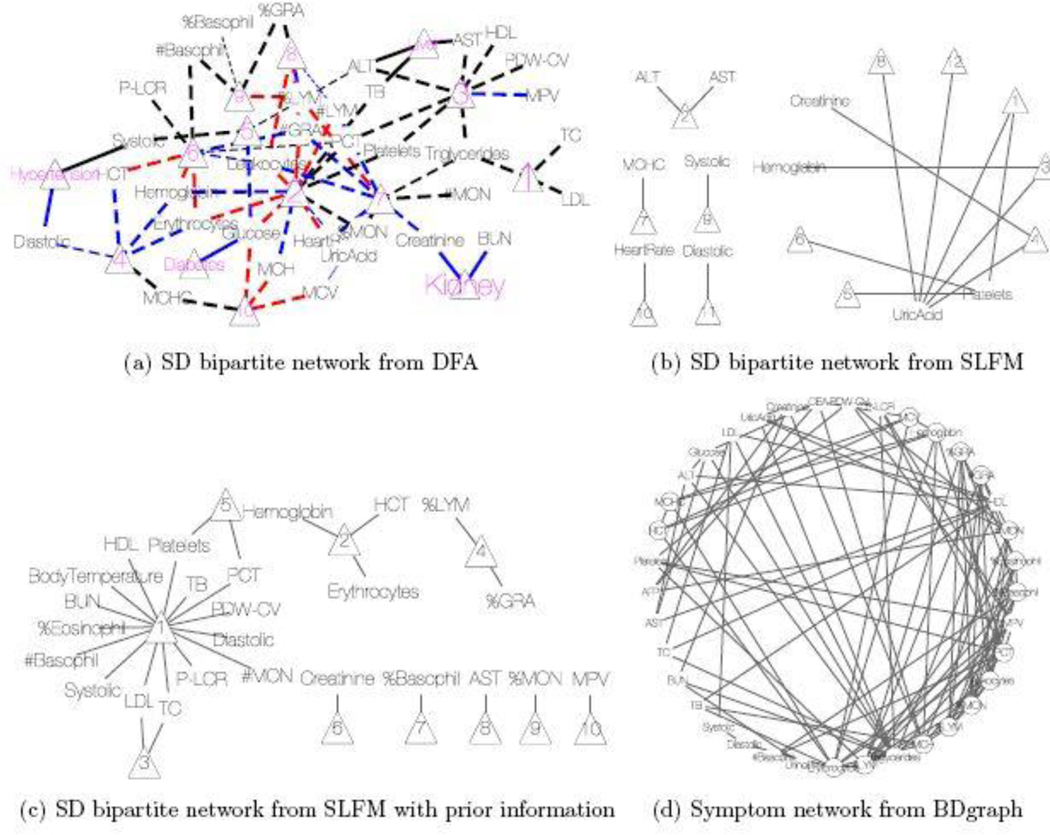
Fig. 8.
EHR data analysis. (a) Bipartite network for symptom-disease relationships from DFA. The diseases are represented by triangles with the font size proportional to its popularity (i.e. the number of patients having the disease). Latent diseases are represented by the numbers (10 latent diseases in total). The symptoms are given in black font and their links to each disease are represented by the lines. Dashed lines are symptom-disease relationships inferred from the data whereas solid lines are fixed by prior knowledge. Black lines indicate the symptoms are binary. Red (blue) lines indicate the disease causes the symptom to be lower (higher) than normal range. The line width is proportional to its posterior probability of inclusion. (b)&(c) Bipartite networks for symptom-disease relationships from SLFM. Latent diseases are represented by triangles (8 latent diseases in total). In (b), no transformation is applied to the raw data whereas in (c) the raw data is scaled and centered using reference range information. (d) Network for symptom-disease relationships from BDgraph. There are 5 cliques of length greater than 3 in total. The symptoms that form those cliques are represented by circles.

